Differences in student outcomes
How do student outcomes vary by disability status?
Degree outcomes
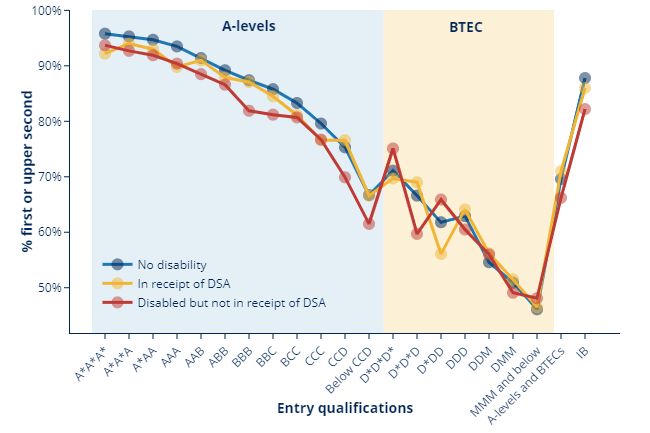
The proportion of graduates without a disability who achieve a first or upper second class degree is 80 per cent, whereas for disabled graduates - whether in receipt of DSA or otherwise - it is 77 per cent. The gap between graduates without a disability and disabled graduates, whether or not in receipt of DSA, has remained at three percentage points from 2013-14.
Among those with A*A*A* at A-level on entry there is a four percentage point difference between those in receipt of DSA and those with no reported disability. However, among those with BTEC D*D*D on entry, the proportion for those in receipt of DSA is two percentage points higher.
The proportion gaining a first or upper second class degree is higher for graduates without a disability regardless of A-level grades (with the exception of CCD), but that outcomes are more mixed for other Level 3 entry qualifications.
Among graduates in receipt of DSA, the difference between the actual percentage and the expected percentage is 1.6 percentage points, while the difference among those declaring a disability but not in receipt of DSA is 3.2 percentage points, once the additional factors have been taken into account.
| First or upper second class degree | Reference (no disability reported) | Observed difference | Unexplained difference | |
| No disability reported | 79.7% | 79.7% | - | - |
| In receipt of DSA | 76.8% | 79.7% | -2.9pp | -1.6pp |
| Disabled but not in receipt in DSA | 76.8% | 79.7% | -2.9pp | -3.2pp |
Employment outcomes
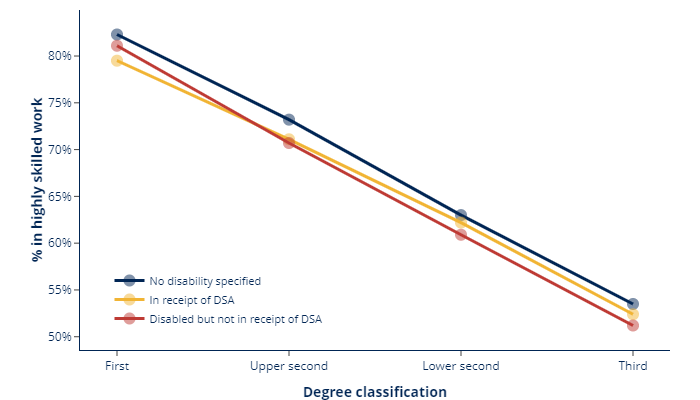
For employment outcomes, the differences are slightly larger, with 73 per cent of graduates without a disability in highly skilled employment or further study. For graduates in receipt of DSA, 71 per cent are in highly skilled employment or further study. The employment rate in highly skilled work among disabled graduates who are not in receipt of DSA is 71 per cent.
The gap between graduates without a disability and graduates in receipt of DSA has increased from 2.0 percentage points in 2013-14 to 2.6 percentage points in 2015-16. The gap between disabled graduates not in receipt of DSA and those without a disability has increased from 2.2 percentage points in 2013-14 to 2.8 percentage points in 2015-16.
The gap remains at around two percentage points across degree classifications among disabled graduates, whether in receipt of DSA or otherwise. Therefore, differences in degree classification do not explain the differences in the employment outcomes of disabled and non-disabled graduates.
The difference between the groups is reduced slightly once different characteristics are accounted for.
| In highly skilled employment or further study | Reference (no disability reported) | Observed difference | Unexplained difference | |
| No disability reported | 73.4% | 73.4% | - | - |
| In receipt of DSA | 70.8% | 73.4% | -2.6pp | -1.4pp |
| Disabled but not in receipt in DSA | 70.6% | 73.4% | -2.8pp | -1.9pp |
Get the data
Last updated 22 December 2021 + show all updates
22 December 2021 - Charts replaced by static images
Describe your experience of using this website