Recent discussion of POLAR has questioned its utility for targeting underrepresented groups in higher education. But POLAR is, and will continue to be, a powerful tool in the drive for fairer access.
The OfS’s insight event on fairer access and participation in higher education, held earlier this month, saw lively discussion of the POLAR classification – a discussion which has also played out in a number of Wonkhe articles over the past few weeks. POLAR’s critics have argued that using it for contextual admissions risks missing many young people whose circumstances need to be considered.
Yes, used in isolation for this purpose this is a risk. That’s why the OfS is clear that POLAR should always be used in conjunction with other data and information when it comes to decisions about individual students. But POLAR does a number of things that makes it a hugely valuable resource for universities and colleges working hard to close access gaps in their student populations.
The OfS promotes equality of opportunity for all students. Our ambition is that future generations have equal opportunities to access and succeed in higher education, and go on to successful and rewarding careers.
It is, perhaps, not widely understood that the Higher Education and Research Act 2017 (which established the OfS) and regulations require us to address underrepresentation in higher education, not other measures of deprivation and disadvantage.
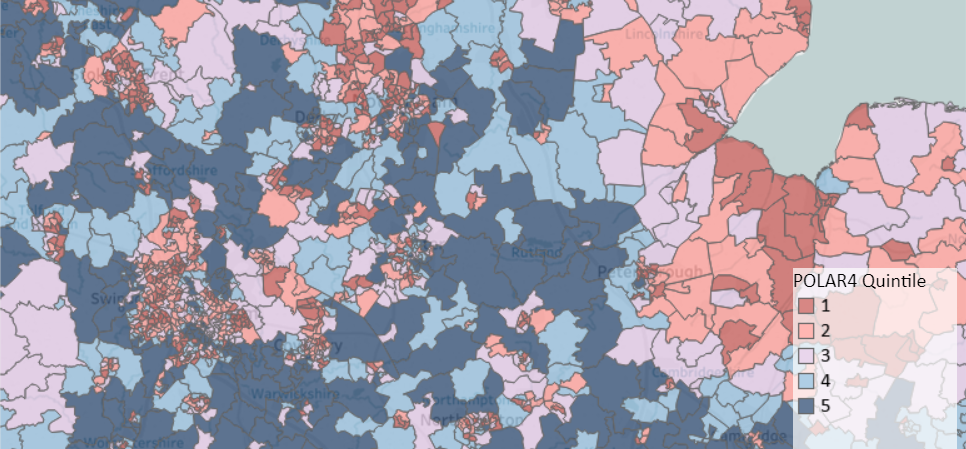
POLAR – Participation Of Local Areas – was developed to directly identify areas of the UK where young participation rates are low, in effect defining underrepresented areas.
POLAR doesn’t attempt to describe why entry to higher education varies across the country (it is likely that different factors are at play in different areas) – it simply identifies the differences. That makes it both a complex synthesis of the various factors that influence access to higher education, and a relatively simple indicator of area-based background. Used to describe sector-level or provider-level differences in access, POLAR shines a light on large and stubbornly persistent gaps in participation.
POLAR measures entry to higher education by age 19 in small geographical areas across the UK. It sorts each area into one of five groups – or quintiles – based on the proportion of young people in the area who enter higher education by the age of 19. Quintile 1 areas have the lowest rate of participation. Quintile 5 areas have the highest rate of participation. It does not assess an area’s socio-economic profile. It is purely and simply concerned with the proportion of young people in a local area who enter higher education.
POLAR is only one part – albeit an important part – of the access and participation picture. Access (or the lack of it) to higher education can be related to socio-economic factors and relative levels of poverty. Many other things affect the likelihood of a young person going into higher education – such as gender; ethnicity; whether their parents went to university; the availability of alternative post-18 opportunities.
POLAR’s critics argue that an area-based measure cannot completely capture this complexity and diversity, and is blind to differences between people who live in the same area.
I agree. POLAR groups people together by where they live. We know instinctively that we are not identical in all respects to our neighbours.
But this is also true for other equality dimensions. Focusing on any single measure of equality – the Index of Multiple Deprivation (IMD), ethnicity, gender, or free school meals – will inevitably conceal variations on other dimensions and create blind spots.
POLAR is no exception. But of the range of measures currently available, it has the strongest ability to discriminate between those young people who progress to higher education and those who don’t.
The Department for Education (DfE) estimates that 26 per cent of English pupils in receipt of free school meals enter higher education by the age of 19. This is the same rate of progression as the POLAR quintile 1 rate. But using POLAR has a wider reach for targeting groups with low participation rates, encompassing over 30,000 more young people than the free school meals measure does.
Not all young people in receipt of free school meals live in POLAR quintile 1 areas (although over 30 per cent of them do). Using POLAR and free school meal measures in combination improves identification of those groups with the lowest participation.
Table 10 of DfE’s experimental statistics shows that entry to higher education by pupil background (free school meals, ethnicity and gender in combination) results in pockets of very low participation. For example, only 13 per cent of English white male pupils in receipt of free school meals go on to higher education.
But within this table are groups large enough to investigate further. Take white males not in receipt of free school meals – 35 per cent of them go on to higher education by age 19 (one of the lowest rates in the table), and they make up over a third of the school year cohort.
OfS analysis of the underlying data shows that white males not in receipt of free school meals who also live in POLAR quintile 1 areas (40,000 pupils) have a participation rate nearly 30 percentage points lower than those who live in quintile 5 areas.
The potential to use more than one measure to uncover groups where differences exist is clear.
The OfS has set out an ambitious new approach to eliminating access and participation gaps. We are challenging providers to develop stretching targets in their access and participation plans. Our guidance recommends that providers consider targets based on POLAR, but it also allows for flexibility in this choice.
Regardless of the measures used, we want to support providers to make sure that targets are not met at the expense of other equality characteristics.
Our access and participation data dashboard will allow the OfS, providers, students and others to check progress against a wide range of measures.
To support providers further, inspired by UCAS’s Multiple Equality Measure (MEM) we are developing a framework for creating intersectional measures of equality. Our aim is that the framework can be applied to each stage of the student lifecycle, recognising that those groups that are underrepresented on entry to higher education are different from groups that have poorer outcomes at later stages.
Note: This article contains data sourced from the DfE's National Pupil Database. The DfE does not accept responsibility for any inferences or conclusions derived from the NPD data by third parties.
Comments
Report this comment
Are you sure you wish to report this comment?