English higher education 2019: The Office for Students annual review
A new approach to fair access, participation and success
An important part of our regulatory role is ensuring fair access to higher education for those who are currently underrepresented, including those from disadvantaged backgrounds. We are not only interested in access: just as important is ensuring successful completion of courses and accessing successful careers after graduation. This chapter looks at our approach to these issues and how we regulate to improve opportunities for all in our universities, colleges and other higher education providers.
Access and participation before the OfS
Although there has been a large increase in the proportion of people going to college or university over the last two decades, this expansion has not benefited all equally. The number of students from the most disadvantaged groups entering professional jobs is lower than it should be, given their qualifications. Graduates should not have to rely on family networks or unpaid internships to get ahead: there is more that universities can do to support valuable work experience for undergraduates to address this disparity.
There are still higher education ‘cold spots’, including coastal regions in the north of England and rural areas in the South West. Some groups have seen only marginal gains from the expansion, such as white men from deprived backgrounds, while other groups, like mature students, have declined. Certain marginalised groups, among them care leavers and the Gypsy, Roma and Traveller community, continue to have participation percentage rates in the single figures.38
Indeed, many of the widening participation issues for higher education highlighted in the 1997 Dearing report resurfaced in the 2019 Augar review. Dearing reported that men from the least advantaged socioeconomic groups were among the least likely to participate; noted a significant gap in the participation between those who come from the most and the least educationally advantaged areas; and observed that black men remained underrepresented in higher education.39 Augar finds that boys are less likely to apply to university than girls; that the most advantaged students are much more likely to go into higher education than the least; and that black students are less likely to apply than other minority ethnic groups.40
While there has been improvement in the proportion of people from underrepresented groups going into higher education, there remain stark access gaps. How exactly to eradicate these gaps has long been a matter of debate. In the 1980s, much of the focus was directed at alternative qualifications (such as BTECs and Access to Higher Education) and diversification among providers.41 By 1997, the Dearing report encouraged universities to run more widening participation projects and outreach activity.42 More recent white papers and reviews have focused on shifting expectations (resulting in the establishing of Aimhigher in 2004, and more recently the National Collaborative Outreach Programme) and encouraging the wider use of contextual admissions to increase the number of disadvantaged students.43 Universities and colleges committed to spend £176 million of their higher education fee income on outreach activities in 2019-20, but significant access gaps remain.44
The access gaps we are concerned with differ in a number of key ways. They have different causes, some being more obviously due to the cost of higher education while others relate to wider social inequalities. Many are linked to school exam results and the persistent attainment gap between disadvantaged and advantaged children. It is worth unpicking some of their unique dynamics before assessing how they might be eliminated.
This chapter outlines the most significant access gaps, and then moves on to the OfS’s role in helping universities and colleges to close them. It then examines the initiatives undertaken in the sector in the last year to eradicate these gaps. Finally, it evaluates the success of this ambition and outlines what we propose to do in the future.
Stagnation and change in access
Educational attainment and barriers to success
University is just one link in an educational chain that stretches back to nursery school and forward to further training and employment. The impact higher education can have is in many ways constrained by the education children receive before it, just as university and college education is a key determinant of which jobs are open to graduates.
A familiar complaint from some university leaders has been that by the time children finish compulsory education, the differences between them are already entrenched, and that universities cannot and should not be expected to compensate for this. Thankfully, such attitudes are changing, but we still should not underestimate the impact of a child’s earlier educational experience.
Studies have shown that, for example, by the age of 11, disadvantaged pupils are over nine months behind their more advantaged counterparts.45 On average, disadvantaged students are two years behind their more advantaged counterparts by the end of secondary school. Only 4.9 per cent of children who are eligible for free school meals receive A-level grades of AAA or better, compared with 11 per cent of those who are not eligible. Only 4.7 per cent of black children get AAA or better, as opposed to 10.8 per cent for white children.46
We know that many of these students are less likely to enter higher education. Students who received free school meals while at secondary school are half as likely to enter higher education as those who did not.47 Black students are less likely to gain entry to high-tariff universities.48 Young people who live in an area with the lowest rates of participation in higher education are nearly six times less likely to go to a high-tariff university than those from areas with the highest.49 If they do go to university or college, they often pay a ‘poverty premium’: they are more likely to take on debt and to have to work to pay for their living costs while in education.50
Many of the higher education reforms of the 1980s, 1990s and 2000s were centred around ensuring that relatively poor attainment at secondary school did not necessarily preclude access to higher education. This focus on ensuring there could be second chances saw the introduction of Access to Higher Education qualifications and foundation years. Today, about 40 per cent of people from the UK attend university and college before the age of 20.51
But, for instance, while only 6 per cent of care leavers enrol in higher education by the age of 21, by the age of 23 this figure has risen to 11.8 per cent.52 This second chance has been one of the great strengths of English higher education.
However, in recent years, many of these second chances have been eroded. Since 2012, when prisoners became ineligible for student loans for higher education, the number of them who take courses has fallen by 42 per cent.53 Changes in the eligibility guidelines for personal independence payments mean that many disabled students are struggling to continue to access higher education.54 Mature student numbers have halved since fees were introduced in 2012.55
But while poverty may be a barrier to high attainment and expectations, it is no guide to potential. Therefore, it is imperative that universities and colleges continue to find innovative ways of targeting and encouraging such disadvantaged students, whether by developing deep partnerships with local schools or making more contextual offers. This is not just about uplifting the deserving and gifted, but rather giving more students from marginalised and deprived backgrounds the opportunity to study and succeed. This is about educational opportunities for all.
Today’s student
The archetypal image of a student who moves away from home to study at a university after sitting their A-levels is no longer the norm. Today’s student, compared with their counterpart of 20 years ago, is more likely to go to a local college or university; more likely to report a mental health issue, and more likely to work during their degree.56 After graduation, they are less likely to find graduate jobs or earn as much as their predecessors.57 These are all challenges, of opportunity and quality, for the sector.
Indeed, the education reforms of recent decades have already opened up higher education to a wider cross-section of society. Over that time, more women, more students from minority ethnic groups and more disabled students have attended and succeeded at university.58 Government loans for postgraduate funding mean that more people can afford further study.59 The qualifications allowing entry to higher education have likewise proliferated. Longstanding qualifications like Access to Higher Education and the BTEC have become more common as routes to entry, alongside the increasing provision of foundation years and degree apprenticeships.60
While most students still study at universities (around 90 per cent of the total), some 120,000 are studying higher education in further education colleges.61 Specialist institutions, such as theological colleges and conservatoires, often teach small numbers of students. Over 1,000 prisoners are studying higher education courses.62 Over 10,000 learners started degree apprenticeships in 2017.63 New providers have opened to address specific skills shortages in fields such as engineering.64 Cold spots persist, however, in the geographical distribution of higher education, with coastal areas and the far north of England being particularly poorly served (see Figure 2).
Despite the huge increase in the proportion of young people entering higher education, there remain persistent and significant differences in the proportions of students from particular backgrounds and geographical locations. When we say we represent ‘all students’, this is the diversity and complexity we must take into account.
Figure 2: Maps showing the distribution of higher education places in England, 2017-18
Use the controls on the left of the map to zoom in or out and move the map position.
Figure 2 is a map that shows the distribution of higher education places in England, 2017-18.
Mature students
As shown in Figure 3, one of the most dramatic changes since the introduction of fees at the £9,000 level has been the rapid decline in the numbers of mature students attending university. Since 2012, the number entering higher education over the age of 25 has halved. With mature students making up a significant proportion of part-time students, these numbers have also fallen.65
Because mature students are largely concentrated in a small number of subjects, funding changes can have a marked impact on applicant numbers, and even give rise to employment shortages. Nursing, where mature students made up over 40 per cent of the applicants between 2010 and 2016, saw mature applicants fall by 28 per cent after the bursaries available before 2017 were discontinued.66
This suggests that, for mature students, one of the major considerations in whether they choose to access higher education relates to the extent of the funding on offer and the magnitude of their debt after graduation.
Figure 3: Number of mature undergraduate entrants to English higher education institutions
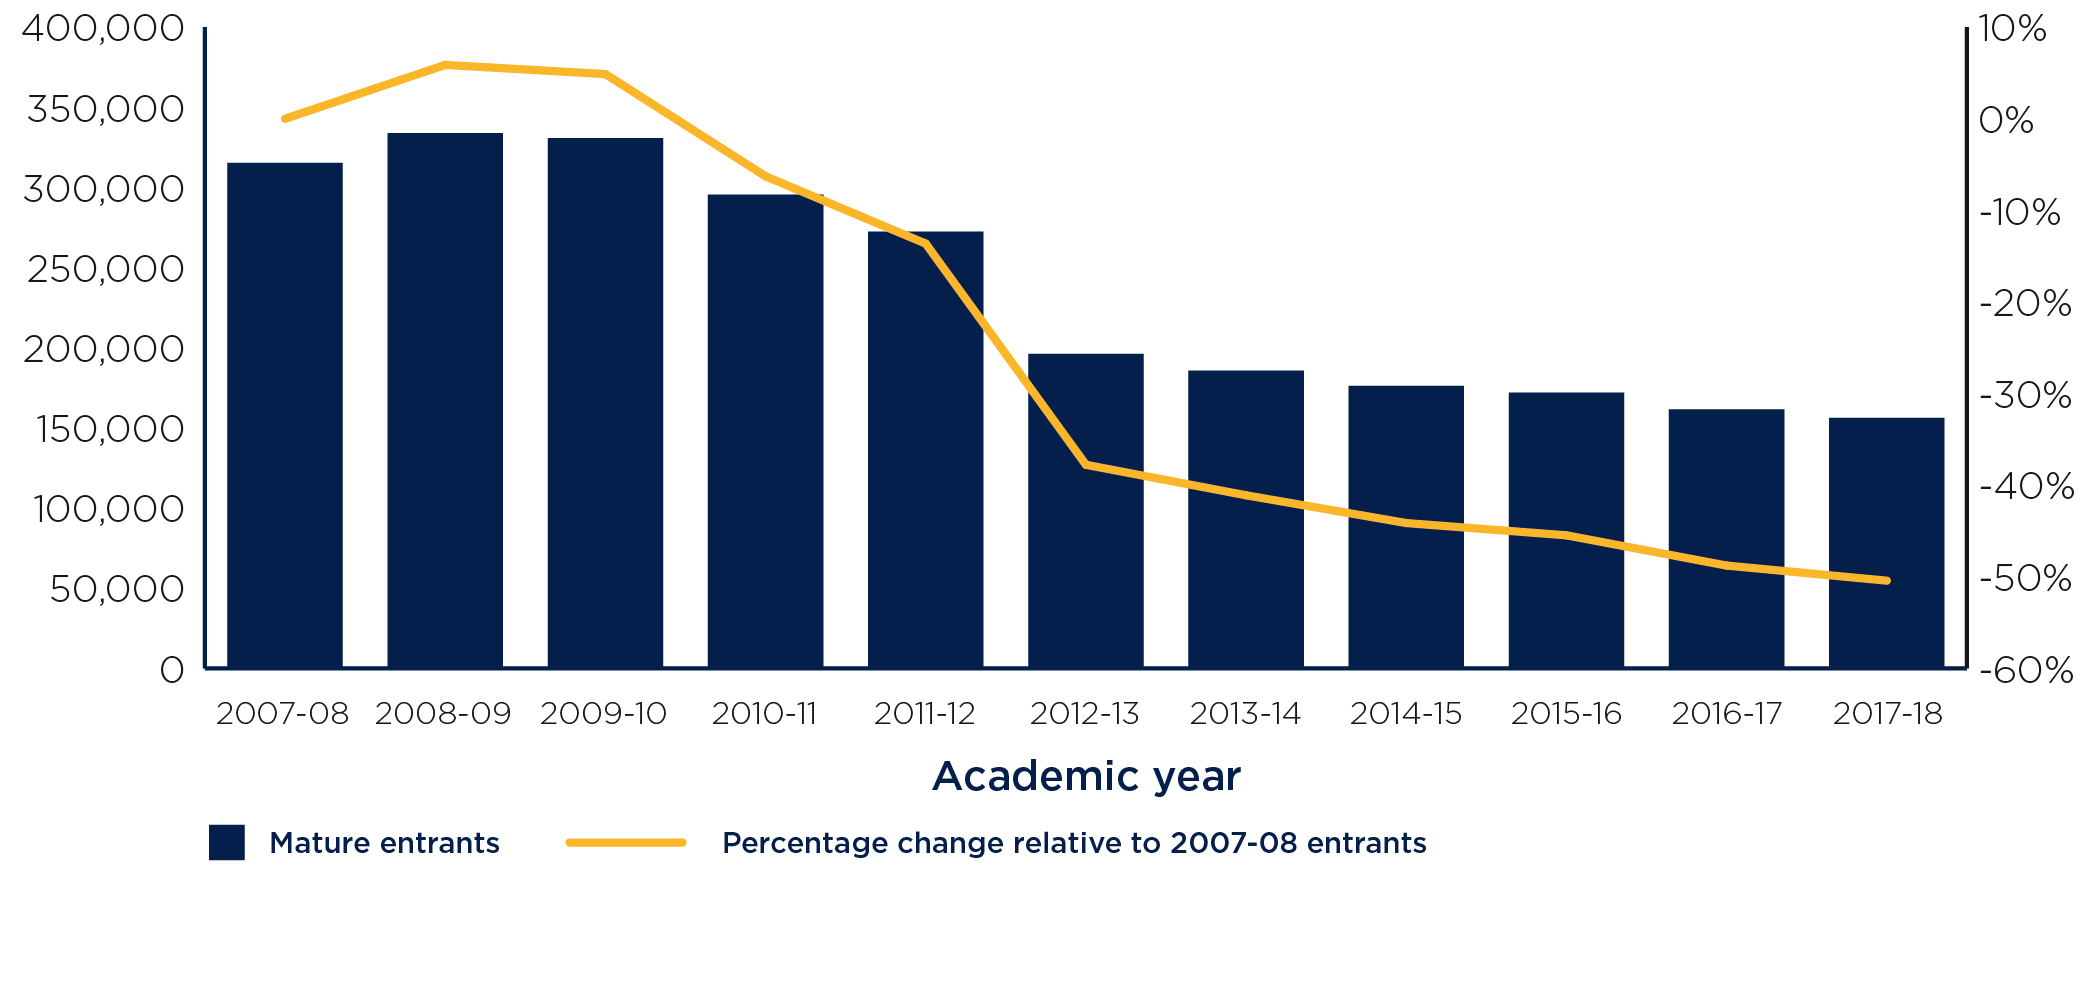
Population: UK-domiciled entrants to undergraduate provision at English higher education institutions who are 21 or over.
Source data: Higher Education Statistics Agency (HESA) student records 2007-08 to 2017-18 data (excluding University of Buckingham).
Figure 3 is a single bar graph showing the number of mature undergraduate entrants to English higher education institutions between 2007-08 and 2017-18. It also has a trendline showing the percentage change relative to 2007-08 entrants.
The graph shows that the number of mature students entering higher education in 2017-18 has declined by 50 per cent relative to 2007-08.
The graph shows that:
- In 2007-08, 315,390 mature students entered higher education. The percentage change relative to 2007-08 was 0 per cent.
- In 2008-09, 333,925 mature students entered higher education. The percentage change relative to 2007-08 was an increase of 6 per cent.
- In 2009-10, 330,785 mature students entered higher education. The percentage change relative to 2007-08 was an increase of 5 per cent.
- In 2010-11, 295,580 mature students entered higher education. The percentage change relative to 2007-08 was a decrease of 6 per cent.
- In 2011-12, 272,415 mature students entered higher education. The percentage change relative to 2007-08 was a decrease of 14 per cent.
- In 2012-13, 196,265 mature students entered higher education. The percentage change relative to 2007-08 was a decrease of 38 per cent.
- In 2013-14, 185,780 mature students entered higher education. The percentage change relative to 2007-08 was a decrease of 41 per cent.
- In 2014-15, 176,210 mature students entered higher education. The percentage change relative to 2007-08 was a decrease of 44 per cent.
- In 2015-16, 171,975 mature students entered higher education. The percentage change relative to 2007-08 was a decrease of 45 per cent.
- In 2016-17, 161,570 mature students entered higher education. The percentage change relative to 2007-08 was a decrease of 49 per cent.
- In 2017-18, 156,360 mature students entered higher education. The percentage change relative to 2007-08 was a decrease of 50 per cent.
Disabled students
When figures alone are considered, the numbers of disabled students attending university appear to be a success story. In 2010, 8 per cent of undergraduate students in England (176,000) reported a disability, compared with 13 per cent (276,000) in 2017.67 However, while some of this change represents disabled people being more likely to attend university or college, some of it reflects the fact that students are more likely to declare their disabilities when they get there.
In any case, challenges remain. A 2019 survey of 1,773 disabled students showed that only 40 per cent were aware of Disabled Student Allowances before starting their course.68 Disabled students now have to pay the first £200 towards any assistive technology they may need, which may be financially challenging for some.69
The kinds of disability students are reporting have also changed in recent years. In 2010, cognitive or learning difficulties including dyslexia were the most common reported group (48 per cent of the total).70 That remained true in 2017, with these difficulties making up 38 per cent of the total. However, mental health is one of the fastest growing reported disabilities, perhaps due to increased social acceptance of its disclosure. It constitutes 24.6 per cent of the total, compared with 8 per cent in 2010.71
The increase in disabled student numbers has seen more universities and colleges commit to embedding a social model in their teaching.72 For example, a number of them now record all lectures, have licensed accessibility software for all computers, or offer a choice of assessment options. The OfS currently commits £40 million annually to help providers to become more inclusive of disabled students.
Ethnicity and access
Since the 1990s, most minority ethnic groups have accessed university at a higher proportion than the general population of 18- to 30-year-olds, thanks in part to the success of educational interventions such as the London Challenge in areas with high proportions of such students. The exceptions in the 1990s were Bangladeshi women, whose access has since improved, and black men.73 Since 2007, the ethnic group with the lowest access to higher education, proportionally speaking, has been white people. More specifically, this access gap is most evident for white men from economically deprived and educationally disadvantaged areas, closely followed by women from the same areas.74
Some notable disparities, however, exist at subject and provider level. In 2017, only 80 out of 1,670 students of veterinary medicine (5.0 per cent) were from minority ethnic groups. Similarly, of the 6,810 students in agriculture or a related subject, only 340 (4.9 per cent of those with known ethnicity) were from these backgrounds.75
At a provider level, there is a pronounced gap between black students and those of other ethnicities at high-tariff universities. In 2018, only 6.8 per cent of black 18-year-olds entered a high-tariff provider compared with 8.9 per cent of white 18-year-olds.76 Thus, while black teenagers are increasingly entering higher education, their participation is patchy and mainly concentrated in low and medium-tariff providers.
Socioeconomic background
While there has been significant improvement over the last decade in the number of people from deprived backgrounds going to university and college, the gap between the proportions of students from poorer and wealthier backgrounds remains substantial (see Figure 4). This disparity is worse among young men than young women.77
Indeed, much of the closing of access gaps in the 1990s came as a result of minority ethnic groups’ improved results at school and the increasing prosperity of second-generation immigrants. Family background, type of schooling, relative wealth and cultural capital remain some of the greatest predictors of whether or not a child will progress onto university.78 This fact is illustrated by the experience of those who have lived in care, only 6 per cent of whom progress into higher education by the age of 21.79
In the face of such entrenched underrepresentation, despite concerted investment to improve access and despite successive governments’ commitment to social justice and mobility, radical changes are needed. If we are to succeed in establishing truly equal access to higher education, we need progress on narrowing the gap in schools, and for universities to take account of background and potential in their admissions, while also introducing entry routes other than those leading straight from school.
Figure 4: Gap in participation at higher-tariff providers between the most and least represented groups
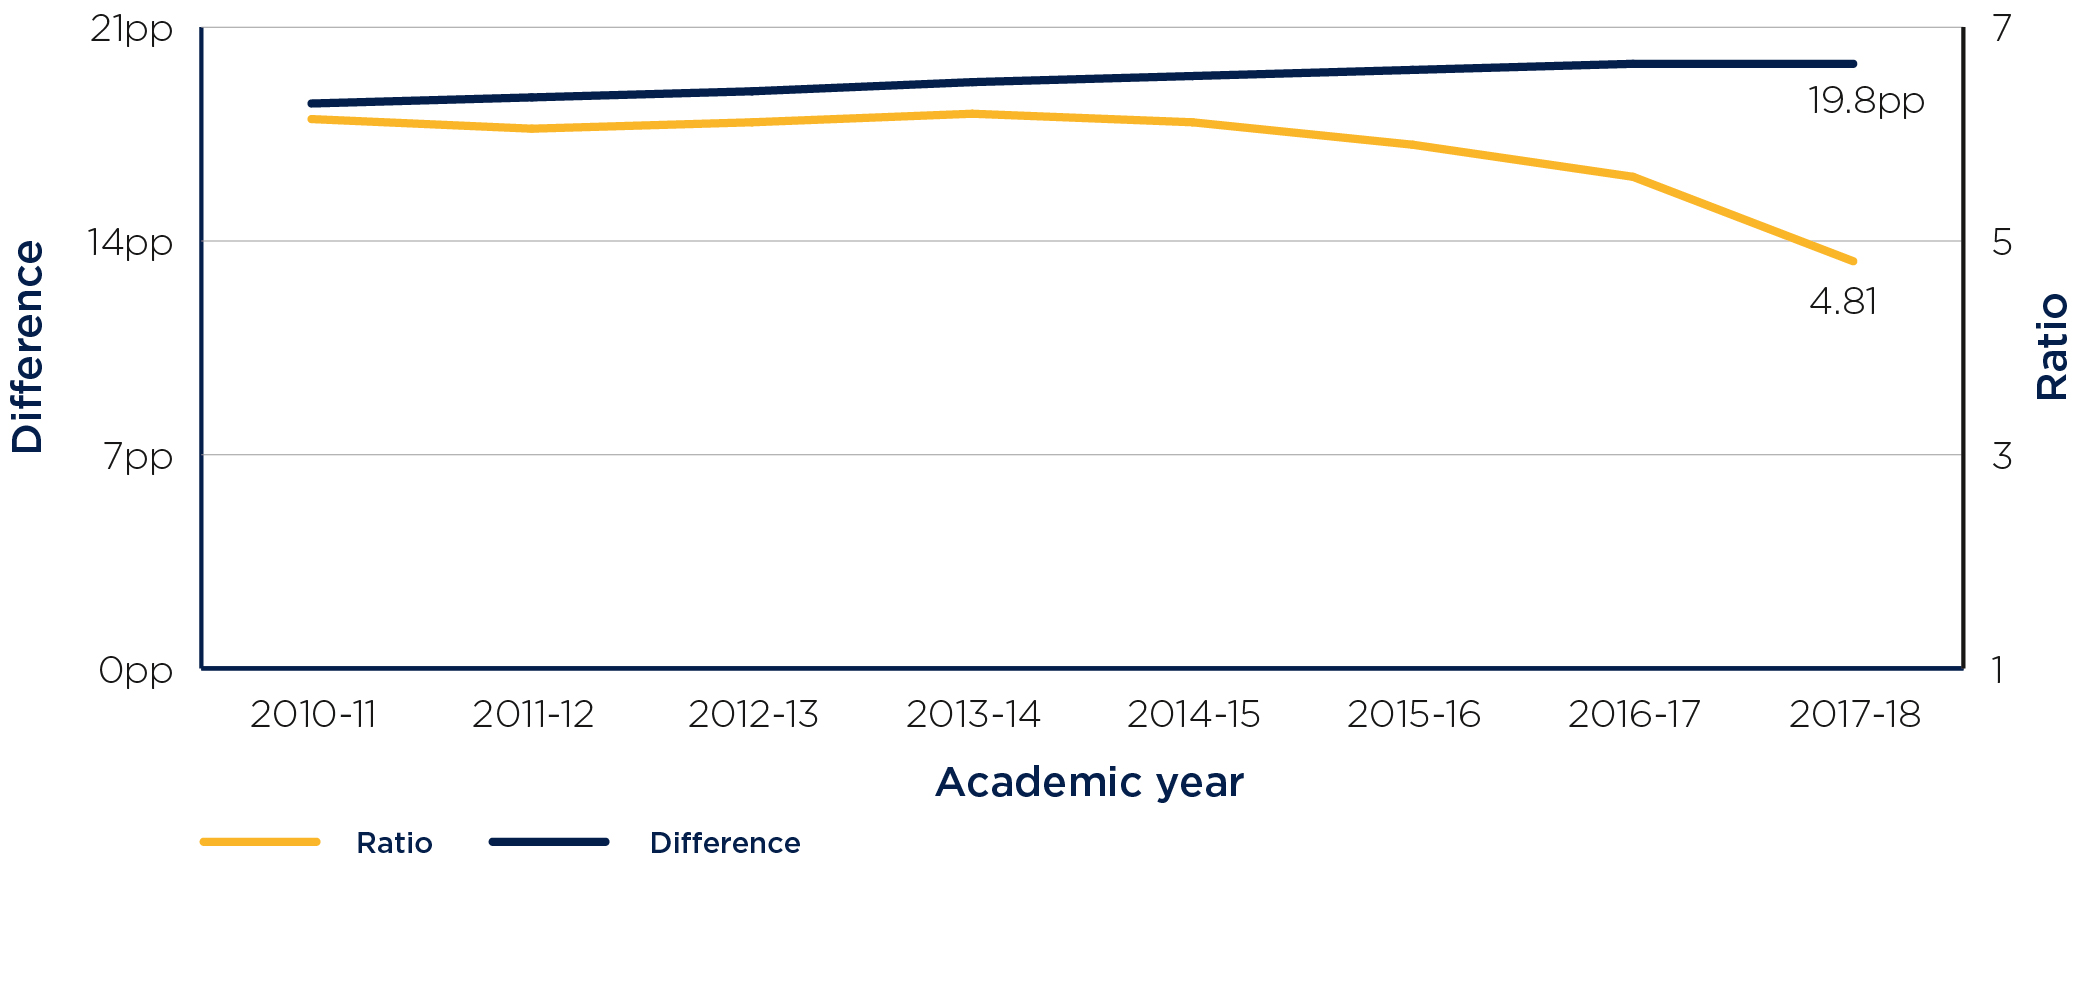
Note: ‘pp’ = ‘percentage point.
Population: 18- to 30-year-old home students domiciled in England who have participated in higher education at higher-tariff providers in England.
Source data: Individual student data HESA, Individualised Learner Record (ILR), Participation of Local Areas (POLAR4) classification of postcodes.
Figure 4 is a double line graph showing the gap in participation at higher-tariff providers between the most and least represented groups.
It shows that, since 2013-14, the ratio between the most and least represented groups has declined with the percentage point gap has increased slightly.
The graph shows:
- In 2010-11, there was a ratio of 6.14 and a percentage point gap of 18.5 between the most and least represented groups.
- In 2011-12, there was a ratio of 6.05 and a percentage point gap of 18.7 between the most and least represented groups.
- In 2012-13, there was a ratio of 6.11 and a percentage point gap of 18.9 between the most and least represented groups.
- In 2013-14, there was a ratio of 6.19 and a percentage point gap of 19.2 between the most and least represented groups.
- In 2014-15, there was a ratio of 6.11 and a percentage point gap of 19.4 between the most and least represented groups.
- In 2015-16, there was a ratio of 5.90 and a percentage point gap of 19.6 between the most and least represented groups.
- In 2016-17, there was a ratio of 5.60 and a percentage point gap of 19.8 between the most and least represented groups.
- In 2017-18, there was a ratio of 4.81 and a percentage point gap of 19.8 between the most and least represented groups.
The innovative regulation of the OfS
In response to these persistent gaps, the OfS has radically reformed the regulation system. We require every university and college that wants to charge fees up to the higher limit to submit a plan that sets out how it will improve equality of opportunity for underrepresented groups to access, succeed in and progress from higher education. These plans must include:
- the provider’s ambition for change
- what it intends to do to achieve that change
- the targets it has set
- the investment it will make to deliver the plan
- how it will evaluate whether its work is succeeding.
The OfS monitors access and participation plans to make sure that the providers honour the commitments they make to students, and we are empowered to take action if not. This scrutiny is underpinned by reforms to individual provider regulation, through the access and participation plans; by sector-level regulation, through activities to support and promote effective practice; and by financial investment, through dedicated OfS access and participation funding.
These reforms differ from the access agreements administered by our predecessor organisation, the Office for Fair Access, in a number of key ways. We require more systematic analysis of characteristics among a provider’s student body, including age and disability, and more honest and rigorous self-assessment, backed up by national data. To support providers we have published the first comprehensive national dataset on access and participation.80
We do not specify the level of investment in disadvantaged students that a provider must make before it can charge fees at the maximum level, as was once the case. Rather than standardising investment, we want universities and colleges to tailor it to align with their plans. We are interested in effective, efficient, evidence-based interventions with proven outcomes. We have more powers to draw on if we believe a university or college is failing in its access and participation measures: not only can we lower the maximum amount it can charge for fees, we can also require it to take specific actions under ongoing conditions of registration, or report on specific aspects of its plans to ensure progress.
This aspect of OfS regulation is one where we are at our most hands-on. For example, we will review progress annually, including analysing the patterns and trends shown in the access and participation dashboard. We will also publish data on providers’ progress. If a provider is at risk of not meeting its targets, we may require it to submit an updated plan, but if it is making sufficient progress, it can keep a plan in place for five years. Such flexibility in regulation means that we can focus on those with the most pronounced equality gaps, while intervening less in those with smaller access gaps.
For example, the Universities of Oxford and Cambridge had specific conditions placed on them in July 2018 relating to the impact and effectiveness of the large amounts they were spending on financial support for students such as bursaries.81 These conditions were lifted a year later after they carried out robust evaluations of their financial support, and our monitoring and engagement are now focused on other aspects of their access and participation plans.
To assess our own and the sector’s performance, we have adopted a number of key performance measures. To encourage innovative approaches and to allow their initiatives to bed down, universities and colleges have been given an extensive timescale to achieve these targets.
While we are setting shorter-term targets for progress over the next five years, we have also set long-term ambitions to reflect the generational challenge facing universities and colleges. For instance, we intend that the gap between Participation of Local Areas (POLAR4) quintile 1 and 5 students at high-tariff providers (a gap of 19.8 percentage points in 2017) should be fully closed by 2038.82 The long deadline means that universities and colleges can focus on delivering and assessing the impact of their plans rather than having to concern themselves with short-term evaluation and administration. We consulted widely to inform these targets, including with the National Union of Students and with academic and support staff. Providers are required to involve students in the development of their plans and we will be actively involving them in monitoring. In support of this, we have developed a ‘How to get involved’ section on our website, running concurrently with a YouTube campaign.83
For the first time we have published comprehensive data underpinning the analysis for all providers, in the access and participation data dashboard on our website.84 This resource, which represents a significant breakthrough in the availability and comparability of such data, will be updated annually with the most recent data as it becomes available. At present it allows specialist users to compare how their university or college’s access and participation rates measure up. It has proved valuable particularly in giving all providers the data needed to assess their own performance in this area, and in allowing us to challenge providers to set more ambitious targets.
From 2020 we expect to update the dashboard to improve transparency for non‑technical users, so that students, staff and students’ union officers can use the data to see where their provider excels and where it needs to improve.
We have also published an experimental measure based on the associations between characteristics for students (ABCS) that combines data on a number of characteristics including POLAR, other area‑based measures, gender, and ethnicity.85 We anticipate that this measure will have the potential to allow universities to better identify particular groups of students who have different outcomes across the student lifecycle.
In support of all of this, the OfS has commissioned the Centre for Transforming Access and Student Outcomes in Higher Education (TASO).86 This centre is intended to generate and collate evidence of ‘what works’ in access and participation, and to equip providers with the tools they need to deliver successful outcomes for students. By evaluating and sharing effective practice, TASO will help to drive reforms in the sector.
Working towards fairer admissions
This year there have been a number of developments in the sector in relation to admissions. Many universities have introduced more radical contextual offer schemes. The University of Warwick announced plans to reduce its advertised offer by up to four grades for disadvantaged local candidates.87 York St John University overhauled its admissions system to include a variety of offers, allowing for a standard conditional, an unconditional, or a reduced points offer. Its contextual offer is the most radical thus far published by an English university: a reduction of up to 40 UCAS tariff points (equivalent to five grades at A-level).88
Other universities have expanded their use of foundation years for students from disadvantaged backgrounds. The University of Oxford, for example, announced its intention to offer a foundation year to 50 students a year from 2021, alongside other measures such as a summer bridging programme and online support for students.89 The University of Cambridge is opening a similar scheme from 2020 for around 200 disadvantaged young people.90
One of the barriers to implementing widespread and holistic contextual offers has been the lack of data available to admissions officers at the application stage. For example, it is important for universities to use more than just an area‑based measure such as POLAR to decide whether or not to make a reduced offer, to recognise more fully the context in which grades have been achieved.91
We have scrutinised other forms of admissions practices during the past year. The percentage of students receiving unconditional offers has ballooned from 1.1 per cent in 2013 to 37.6 per cent in 2019.92 Research from the OfS showed that unconditional offers were being made disproportionately to students from less represented areas. We pointed out that the practice of universities making conditional unconditional offers – whereby an applicant has to make the university their firm choice to get the lower offer – had the potential to put undue pressure on students to accept a place at the university in question.93
The OfS has decided to explore whether current admissions practices are best serving the student interest and to propose ways they might be improved.
Case study: Eliminating educational and economic disadvantage gaps at St George’s, University of London
St George’s intends to reduce the gap between the proportion of POLAR4 quintile 1 and 2 students and POLAR4 quintile 5 students among young, full-time undergraduate entrants who reside outside Greater London, from 7.1 per cent in 2017-18 to zero in 2024-25. It also aims to increase the proportion of Index of Multiple Deprivation quintile 1 entrants among young, full-time, undergraduate entrants from 17.9 per cent to 22.9 per cent in 2024-25.
The university aims to achieve this by reviewing its long-term outreach, recruitment and admissions strategies, as well as expanding the reach of its outreach activities. The plan also includes developing new course provision, including a foundation year, and a more comprehensive approach to contextualised admissions.
Evaluating success
We have challenged providers to commit to achieving better outcomes for students, by reducing the gaps between underrepresented students and their peers. We have also challenged them to demonstrate value for money, by improving outcomes for students and the evaluation of their activities.
All providers have demonstrated greater ambition and credibility than in previous access and participation plans, in both their targets and their practice. Some have been particularly ambitious, which should result in better outcomes and improved equality of opportunity for underrepresented groups of students. We have applied more scrutiny to those providers that have the furthest to travel to reach this goal.
We have applied risk mitigations to monitor progress in relation to the targets and activities set out in the plans, and in some cases to further challenge the level of ambition. A broad range of providers have been subject to regulatory interventions. Interventions the OfS has made include approving plans over a shorter period (two or three years instead of five), requiring engagement with the Director for Fair Access and Participation, and asking for reports on the progress of specific interventions and their impact, and variations to plans, including revising targets.
We have completed the majority of the access and participation plan assessments for 2020-21. We will publish a fuller analysis in the new year, once most assessments and discussions with providers have been completed.
How the OfS is supporting the sector to achieve its goals
The National Collaborative Outreach Programme is intended to increase the proportion of disadvantaged young people going into higher education. Launched in 2017, It supports impartial and sustained higher education outreach by a range of institutions, tailored to the needs of young people in target areas.
So far the programme has engaged 100,000 young people across the whole of England. Some of the schools and colleges the projects have engaged had not had any interaction with university outreach events since the Aimhigher programme ended in 2011. The participants have benefited from mentoring by university graduates, attended campus visits, and gone to summer schools at universities. The aim of these projects is to improve the participants’ knowledge of, attitude to and aspiration towards higher education.94
We are working on a campaign to promote the opportunities the programme gives school students more widely, to teachers and parents.
Conclusion
This year we have assessed 224 access and participation plans. The strategies they detail are, in the main, ambitious. To encourage more effective evaluation and robust data collection, we have set up the evidence centre TASO and published provider-level data on our website.
We will:
- Continue to explore and make available new ways of identifying underrepresented groups in higher education, by, for example, working with UCAS to make free school meals data available to universities at the point of prospective students’ application.
- Trial our new experimental data, which will allow an exploration of the extent of access gaps for students with multiple characteristics: for example, whether a black disabled woman has less chance of entering higher education than someone with only one of these characteristics.
- Invest in skills to support inclusive growth, for instance by setting up funding to bridge skills gaps in the area of artificial intelligence.
- Launch a challenge competition in 2020 aimed at supporting and encouraging greater diversity of provision, including innovation and technological solutions in flexible and part-time learning.
Overall, the sector has already begun to respond to our regulation in innovative ways. This year has been about bedding down our new regulation requirements; the next will be about supporting universities and colleges to fully implement them.
Case study: Reducing the access and participation gap through multiple approaches at the University of Manchester
The University of Manchester aims to reduce the access gap for underrepresented students to a ratio of 3:1 (in line with the OfS Key Performance Measure), to reduce the degree attainment gap between black and white students by half, and to eliminate the degree attainment gap between disabled and non‑disabled students.
The university aims to achieve this by reviewing its contextual admissions policy, using the newly established University of Manchester Institute of Teaching and Learning to review the curriculum and assessment methods, and collaborating with other universities and colleges in Greater Manchester, alongside the NHS, to pilot the Greater Manchester Student Mental Health Hub.
38 DfE, ‘Children looked after in England including adoption: 2017-18’, December 2018 (https://www.gov.uk/government/statistics/children-looked-after-in-england-including-adoption-2017-to-2018); ONS, ‘Widening participation in higher education, England, 2016-17 age cohort: Experimental statistics’, November 2018 (available at https://www.gov.uk/government/statistics/widening-participation-in-higher-education-2018) p6.
39 Dearing, ‘Higher education in the learning society’, 1997, pp103-105. The report refers to ‘Afro-Caribbean’ students.
40 The Augar review, ‘Post-18 review of education and funding: Independent panel report’, May 2019 (available at www.gov.uk/government/publications/post-18-review-of-education-and-funding-independent-panel-report), p24.
41 ‘Higher education: Meeting the challenge’, 1987 (available at www.educationengland.org.uk/documents/wp1987/1987-higher-ed.html), pp9-11.
42 Dearing, ‘Higher education in the learning society’, 1997, pp108, 233.
43 ‘The future of higher education’, 2003 (www.educationengland.org.uk/documents/pdfs/2003-white-paper-higher-ed.pdf [PDF]), pp70-71; ‘Fair admissions to higher education: Recommendations for good practice’, 2004 (https://dera.ioe.ac.uk/5284/1/finalreport.pdf [PDF]), pp5-6; ‘Higher ambitions: The future of universities in a knowledge economy – a summary’, 2009 (available at https://www.advance-he.ac.uk/knowledge-hub/higher-ambitions-future-universities-knowledge-economy-summary), p10.
44 Augar, ‘Post-18 review of education and funding’, p76.
45 Education Policy Institute, ‘Education in England: Annual report 2019’, July 2019 (available at https://epi.org.uk/publications-and-research/annual-report-2019/), pp10-11.
46 DfE, ‘A-level attainment characteristics’, March 2017 (available at https://www.gov.uk/government/publications/a-level-attainment-by-pupil-characteristics), pp5, 7.
47 UCAS, ‘Equality and entry rates data explorers’ (https://www.ucas.com/data-and-analysis/ucas-undergraduate-releases/ucas-undergraduate-analysis-reports/equality-and-entry-rates-data-explorers).
48 UCAS, ‘End of cycle report 2018: Patterns of equality in England’, May 2019 (available at https://www.ucas.com/data-and-analysis/undergraduate-statistics-and-reports/ucas-undergraduate-end-cycle-reports/2018-end-cycle-report) p5. UCAS tariff scores are a way of measuring post-16 qualifications. Universities (excluding specialist providers) are grouped into higher, medium and lower tariffs when ranked by average tariff score of UK-domiciled undergraduate entrants, defined using Higher Education Statistics Agency (HESA) data from the academic years 2012-13 to 2014-15.
49 OfS, ‘Gap in participation at higher-tariff providers between the most and least represented groups’ (www.officeforstudents.org.uk/about/measures-of-our-success/participation-performance-measures/gap-in-participation-at-higher-tariff-providers-between-the-most-and-least-represented-groups/).
50 The Poverty Commission and the National Union of Students (NUS), ‘Class dismissed: Getting in and getting on in further and higher education’, April 2018 (https://www.nusconnect.org.uk/resources/class-dismissed-getting-in-and-getting-on-in-further-and-higher-education (link no longer available)), pp41, 59.
51 ONS, ‘Participation rates in higher education: 2006 to 2017’, September 2018 (available at https://www.gov.uk/government/statistics/participation-rates-in-higher-education-2006-to-2017), p1.
52 DfE, ‘Children looked after in England including adoption: 2017-18’; Harrison Neil, ‘Moving on up: Pathways of care leavers and care-experienced students into and through higher education’, November 2017, pp7, 3.
53 Coates, Sally, ‘Unlocking Potential: A review of education in prison’, May 2016 (available at https://www.gov.uk/government/publications/unlocking-potential-a-review-of-education-in-prison), pp38-39.
54 Ryan, Frances, ‘Disabled students fear for their future as independence payments cut’, Guardian, 4 April 2017 (https://www.theguardian.com/education/2017/apr/04/disabled-students-future-independence-payments-cut-benefits); NUS, ‘PIP cuts pose a serious threat to disabled students’, 8 March 2017 (link no longer available).
55 MillionPlus, ‘Forgotten learners: Building a system that works for mature students’, 2018 (available at www.millionplus.ac.uk/policy/reports/forgotten-learners-building-a-system-that-works-for-mature-students), p20.
56 Sutton Trust, ‘Home and away: Social, ethnic and spatial inequalities in student mobility’, February 2018 (available at https://www.suttontrust.com/research-paper/home-and-away-student-mobility/), p4.
57 ONS, ‘Graduates in the UK labour market: 2017’, November 2017 (https://www.ons.gov.uk/employmentandlabourmarket/peopleinwork/employmentandemployeetypes/
articles/graduatesintheuklabourmarket/2017), Figure 8; Institute of Fiscal Studies, ‘The puzzle of graduate wages’. August 2016 (available at https://www.ifs.org.uk/publications/8409), p4.
58 Dearing, ‘Higher education in the learning society’; HESA, ‘Who’s studying in HE?’ (available at https://www.hesa.ac.uk/data-and-analysis/students/whos-in-he), pp101‑106.
59 OfS, ‘The effect of postgraduate loans’, May 2018 (www.officeforstudents.org.uk/data-and-analysis/the-effect-of-postgraduate-loans/).
60 Universities UK, ‘Growth and choice in university admissions’, June 2018 (available at https://dera.ioe.ac.uk/31719/), p12.
61 HESA, ‘HE student enrolments at HE, FE and designated courses at alternative providers by level of study and HE provider type’ (available at https://www.hesa.ac.uk/news/14-02-2019/sb254-higher-education-student-statistics-APs/totality).
62 Coates, ‘Unlocking Potential’, p38.
63 DfE, ‘Apprenticeship and levy statistics: January 2019’, January 2019 (available https://www.gov.uk/government/statistics/apprenticeship-and-levy-statistics-january-2019), p8.
64 Department for Business, Energy and Industrial Strategy, ‘Industrial Strategy: Building a Britain fit for the future’, November 2017 (available at https://www.gov.uk/government/publications/industrial-strategy-building-a-britain-fit-for-the-future), p101.
65 MillionPlus, ‘Forgotten learners’, p20. Note that the OfS defines ‘mature’ students as those aged 21 or over at the time of entry into higher education.
66 Marketwise Strategies, ‘Research on recruitment of mature students to nursing, midwifery and allied health courses’, March 2019 (available at www.officeforstudents.org.uk/publications/research-on-recruitment-of-mature-students-to-nursing-midwifery-and-allied-health-courses/), p32.
67 OfS, ‘Equality and diversity data’ (www.officeforstudents.org.uk/data-and-analysis/equality-and-diversity/equality-and-diversity-data/).
68 DfE, ‘Evaluation of Disabled Students’ Allowances’, 2019 (available at https://www.gov.uk/government/publications/evaluation-of-disabled-students-allowances-dsas), p9.
69 OfS, ‘Beyond the bare minimum: Are universities and colleges doing enough for disabled students?’ (OfS Insight brief #4), October 2019 (available at www.officeforstudents.org.uk/publications/insight-brief-disabled-students/).
70 HESA, ‘UK-domiciled HE students by level of study, mode of study, gender and disability, 1999-2000’ (available at https://www.hesa.ac.uk/data-and-analysis/publications/students-1999-00).
71 OfS, ‘Equality and diversity data’.
72 The social model of disability holds that people are disabled by barriers in society, not by their impairment or difference. Barriers can be physical, like buildings not having accessible toilets, or they can be caused by people’s attitudes to difference, like assuming disabled people can’t do certain things.
73 Dearing, ‘Higher education in the learning society’, 1997, p105.
74 UCAS, ‘Equality and entry rates data explorers’ (https://www.ucas.com/data-and-analysis/ucas-undergraduate-releases/ucas-undergraduate-analysis-reports/equality-and-entry-rates-data-explorers).
75 OfS, ‘Equality and diversity data’.
76 UCAS, ‘Equality and entry rates data explorers’.
77 Crawford Claire, Dearden Lorraine, Micklewright John, and Vignoles Anna, ‘Family background and university success: Differences in higher education access and outcomes in England’, 2017, p12.
78 Crawford et al, ‘Family background and university success’, 2017, pp1-24.
79 DfE, ‘Children looked after in England including adoption: 2017-18’.
80 OfS, ‘Access and participation data dashboard’ (www.officeforstudents.org.uk/data-and-analysis/access-and-participation-data-dashboard/).
81 Havergal Chris, ‘Oxford and Cambridge singled out on access by new regulator’, Times Higher Education, 19 July 2018 (available at https://www.timeshighereducation.com/news/oxford-and-cambridge-singled-out-access-new-regulator).
82 OfS, ‘Gap in participation at higher-tariff providers between the most and least represented groups’ (www.officeforstudents.org.uk/about/measures-of-our-success/participation-performance-measures/gap-in-participation-at-higher-tariff-providers-between-the-most-and-least-represented-groups/). A quintile is a gradation equal to a fifth. In a set of data, ‘Quintile 1’ is the fifth of the results with the lowest values, while ‘Quintile 5’ is the fifth with the highest values.
83 OfS, ‘Help your university or college tackle inequality’ (www.officeforstudents.org.uk/for-students/help-your-university-or-college-tackle-inequality/).
84 OfS, ‘Access and participation data dashboard’.
85 OfS, ‘Associations between characteristics of students’ (OfS 2019.34), September 2019 (available at www.officeforstudents.org.uk/publications/associations-between-characteristics-of-students/).
86 See https://taso.org.uk/. TASO is a collaboration of King’s College London, Nottingham Trent University and the Behavioural Insights Team.
87 Richard Adams, ‘Warwick University to lower entry grades for disadvantaged pupils’, Guardian, 14 May 2019 (available at https://www.theguardian.com/education/2019/may/14/warwick-university-to-lower-entry-grades-for-disadvantaged-local-pupils).
88 York St John, ‘Our inclusive offers’ (available at https://www.yorksj.ac.uk/admissions/).
89 Adams Richard, ‘Oxford aims to attract deprived students with new foundation year’, Guardian, 21 May 2019 (available at https://www.theguardian.com/education/2019/may/21/oxford-university-aims-attract-deprived-students-foundation-year).
90 University of Cambridge, ‘Address to the University’, 1 October 2018 (available at https://www.v-c.admin.cam.ac.uk/professor-stephen-j-toope/selected-speeches-professor-stephen-j-toope/address-university-1-october).
91 OfS, ‘Frequently asked questions about area-based measures’ (available at www.officeforstudents.org.uk/data-and-analysis/young-participation-by-area/about-the-data/).
92 UCAS, ‘Unconditional offers: An update for 2019’, July 2019 (available at https://www.ucas.com/corporate/news-and-key-documents/news/update-unconditional-offer-making-2019).
93 OfS Insight brief #1.
94 CFE Research et al, ‘NCOP: End of phase one report for the national formative and impact evaluations’, October 2019 (available at www.officeforstudents.org.uk/publications/ncop-end-of-phase-one-evaluation-report/).
Describe your experience of using this website