English higher education 2021: The Office for Students annual review
Equality of opportunity
In terms of who gets the opportunity to enter higher education, and who is more likely to succeed once there, students from certain backgrounds do better than others. The pandemic has seen those who were already disadvantaged fall further behind.1 We negotiate and approve universities’ and colleges’ access and participation plans, then monitor and evaluate their delivery. Where a student comes from, their identity or their life experience should not determine their chances of getting into a course, completing it successfully, and progressing to a successful career or further study.
Addressing attainment gaps
Many children have not had consistent teaching and learning in school during lockdown.2 Exam results have shown substantially higher increases in top grades for independent school pupils.3 This makes it more important than ever that there is strong support for students when they reach university, and sustained work to cut through the academic, financial and cultural barriers to getting into university and getting on once they get there.
In 2020-21 we received 18 notifications relating to equality issues at universities and colleges. In their access and participation plans, universities and colleges detail their plans to deal with persistent disparities. We continue to draw on the information gathered by our designated data body, currently HESA.
This year, we published an independent evaluation of the effectiveness of our regulatory reforms to the five-year access and participation plans that will run from 2020-21 to 2024-25.4 This evaluation concluded that OfS engagement has been a driver for change, and that our reforms have accelerated a shift in culture at the sector level, with the five-year plans providing a framework for a more ambitious and strategic approach. It also pointed to areas for improvement, such as engaging more with students and being clearer in our communications.
The plans set out how providers are tackling problems such as degree attainment gaps between black and white students, and between disabled and non-disabled students. Evidence shows that black students receive proportionately fewer 1sts and 2:1s than their white peers. This gap has been closing, as Figure 4 shows, and reduced by almost four percentage points between 2018-19 and 2019-20. If all universities and colleges that have included targets in their plans meet their targets, the gap in degree outcomes between black and white students will reduce from 18.2 percentage points in 2019-20 to 9.5 percentage points in 2024-2025.5
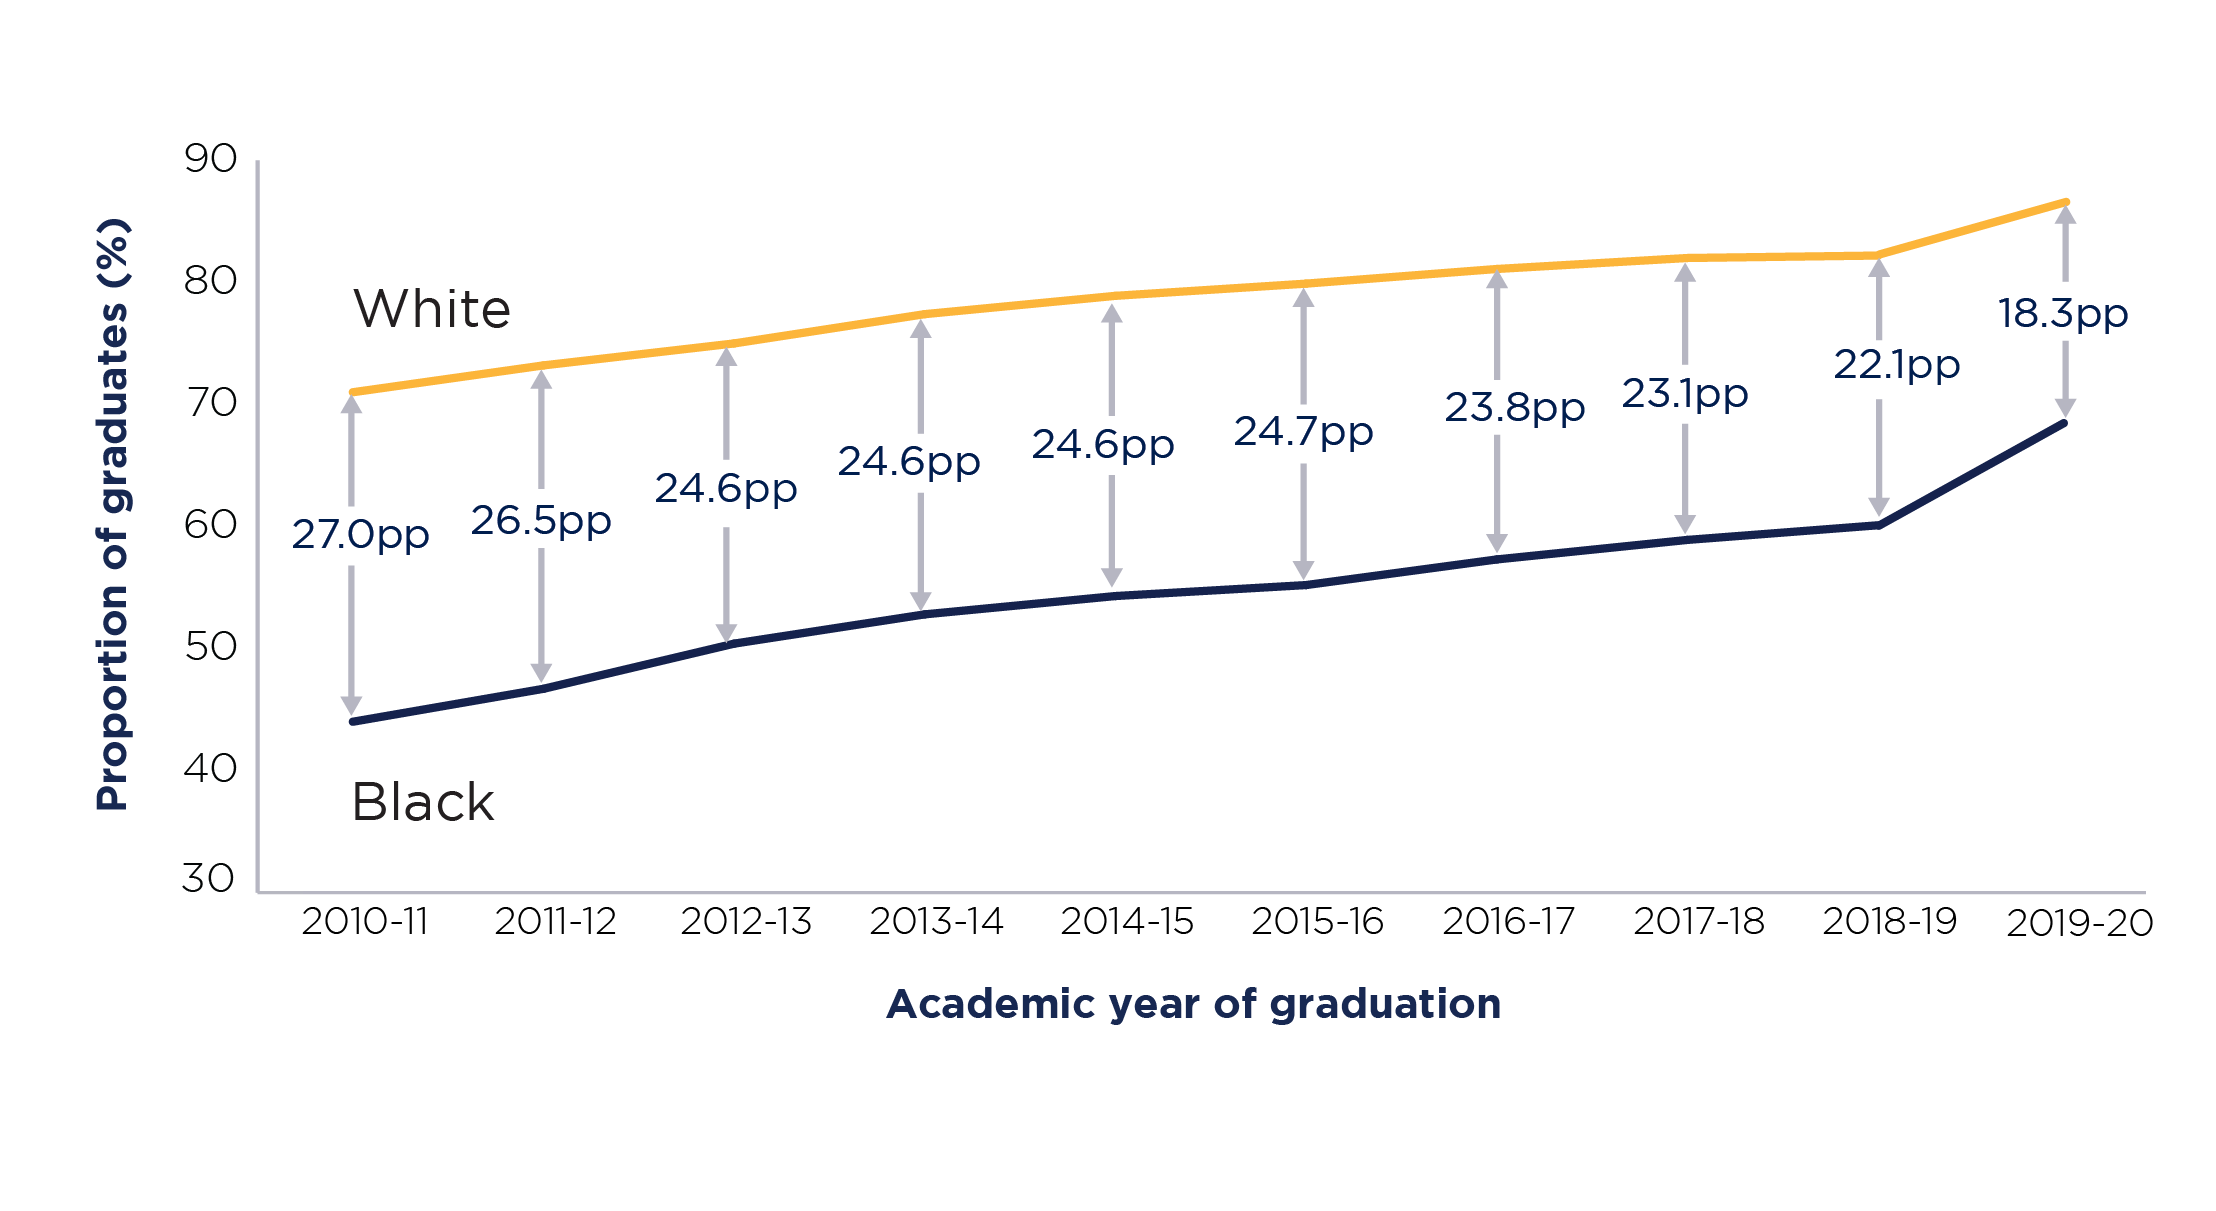
Figure 4: Gap in degree outcomes (1sts or 2:1s) between white students and black students
Source: Individual student data from HESA and the individualised learner record from the Education and Skills Funding Agency.6
Note: The y-axis does not start from 0.
Figure 4 is a double line graph that shows the gap in degree outcomes (1sts or 2:1s) between white students and black students.
It shows that black students receive proportionately fewer 1sts and 2:1s than their white peers. However, this gap has been closing and reduced by almost four percentage points between 2018-19 and 2019-20.
It shows that:
- In 2010-11, 44.0 per cent of black students and 71.0 per cent of white students received 1sts and 2:1s, a difference of 27.0 percentage points.
- In 2011-12, 46.7 per cent of black students and 73.2 per cent of white students received 1sts and 2:1s, a difference of 26.5 percentage points.
- In 2012-13, 50.4 per cent of black students and 75.0 per cent of white students received 1sts and 2:1s, a difference of 24.6 percentage points.
- In 2013-14, 52.8 per cent of black students and 77.4 per cent of white students received 1sts and 2:1s, a difference of 24.6 percentage points.
- In 2014-15, 54.3 per cent of black students and 78.9 per cent of white students received 1sts and 2:1s, a difference of 24.6 percentage points.
- In 2015-16, 55.2 per cent of black students and 79.9 per cent of white students received 1sts and 2:1s, a difference of 24.7 percentage points.
- In 2016-17, 57.3 per cent of black students and 81.1 per cent of white students received 1sts and 2:1s, a difference of 23.8 percentage points.
- In 2017-18, 58.9 per cent of black students and 82.0 per cent of white students received 1sts and 2:1s, a difference of 23.1 percentage points.
- In 2018-19, 60.1 per cent of black students and 82.2 per cent of white students received 1sts and 2:1s, a difference of 22.1 percentage points.
- In 2019-20, 68.2 per cent of black students and 86.6 per cent of white students received 1sts and 2:1s, a difference of 18.3 percentage points.
Many universities and colleges aimed to halve the existing gap by 2024-25. Several will still have large gaps remaining at the end of their plans in 2024-25. These providers included longer-term written objectives indicating the progress they expect to make beyond 2024-25. Some included a commitment to review progress against this target at a midpoint of the plan and engage further with the OfS on their targets and trajectories in this area.
Our monitoring and oversight of access and participation plans will continue to hold universities and colleges to account in meeting their commitments to improve access and reduce attainment gaps.
New equality data
This year, the OfS released sector-level trends in the numbers of students with certain protected characteristics. They show that the demographic of students has shifted considerably over the last decade.
This year we expanded these statistics to cover gender reassignment, religion or belief and sexual orientation, all of which are characteristics protected by law, as well as parental education, which is not. We also published new experimental data on the numbers of students at English higher education providers by care experience, estrangement, household residual income, socioeconomic background, underrepresentation by area, and associations between characteristics of students.7
During the last eight years, black students have seen the biggest percentage point increase in postgraduate study, rising from 5.8 per cent of postgraduate entrants in 2010-11 to 8.3 per cent in 2019-20. On taught masters’ courses, they have risen from 8.0 to 10.0 per cent of the population, though this is down from a peak of 11.5 per cent in 2016-17. In 2019-20, 7.4 per cent of undergraduate entrants identified as lesbian, gay or bisexual, compared with 4.3 per cent in 2015-16, while 2.1 per cent identified with a sexual orientation other than heterosexual, lesbian, gay, or bisexual, slightly more than the 1.8 per cent in 2015-16.8
While there has been considerable improvement for most groups, some are still underrepresented in higher education. This includes care leavers, people estranged from their families, and people from Gypsy, Roma and Traveller communities. Better understanding is needed of the barriers students from these groups can face in accessing and succeeding in higher education.
Furthermore, we have continued to develop our associations between characteristics of students (ABCS) measure, which identifies groups of students by how likely they are to access or continue in higher education based on a set of characteristics.9 These include age, sex, disability and ethnicity, but also such indicators as care experience, eligibility for free school meals, parental education and various indices of deprivation.
Care experienced students
Students who spent time in local authority care as children are less likely to continue into the second year of their course. Last year, the OfS published outcomes statistics by care experience for the first time. This analysis showed that the continuation rate of care experienced 2017-18 entrants was 5.6 percentage points lower than the rate of other students – 86.7 per cent as opposed to 92.3 per cent. This gap is reducing year on year, and has fallen by 1.9 percentage points since 2014-15 (see Figure 5).10 Other studies have shown that care experienced students often take longer to complete their degrees.11 Such absences, withdrawals, and changes to part-time study are another feature of care experienced people’s disrupted education journey.
The coronavirus pandemic and its rapidly changing implications for higher education have thrown these inequalities into stark relief. While many students have been able to return to their family home during national lockdowns, this option is often not open to care experienced students. Many universities and colleges responded by distributing hardship funds, providing essential supplies, running online events, strengthening student networks, and extending accommodation leases. Much of this support has been valuable, and its best examples should not be lost after the pandemic is over. It will be all the more important in the light of reports of increasing numbers of children at risk of abuse and entering care over the past year.
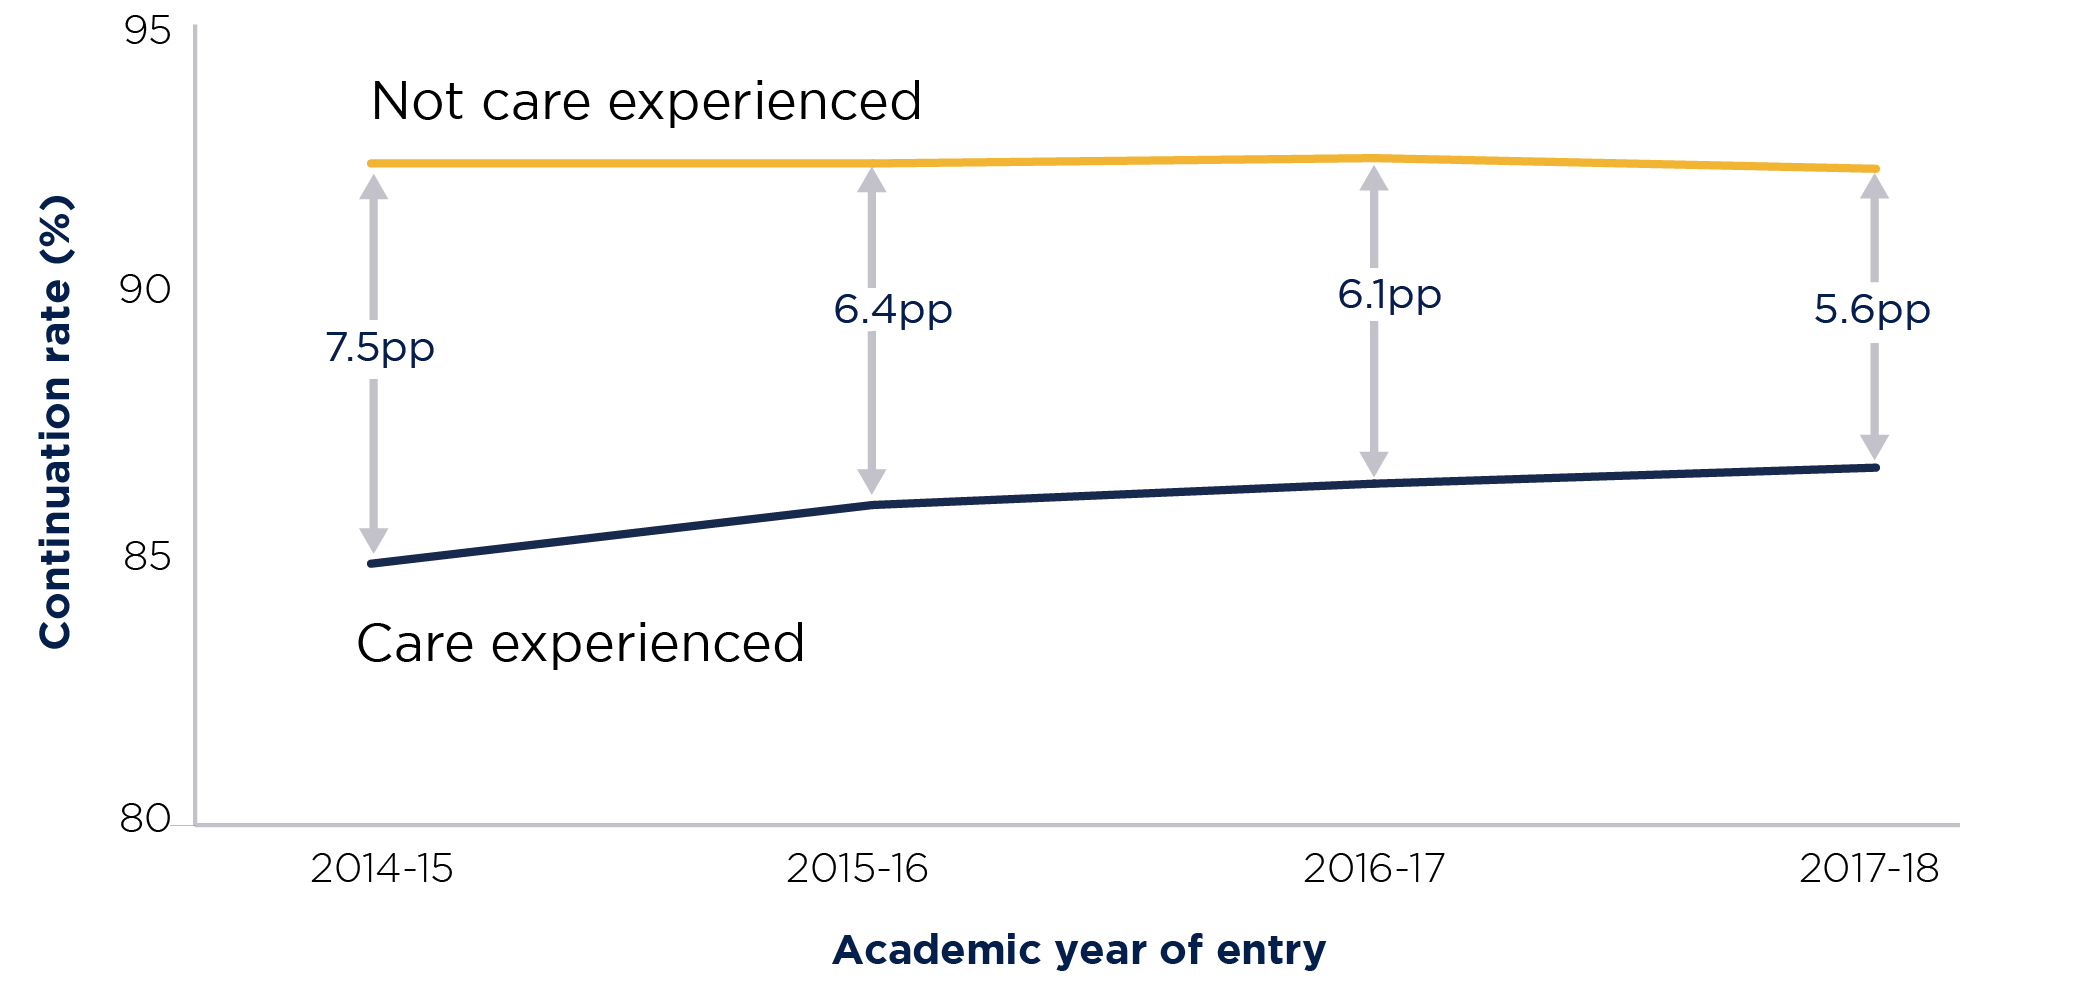
Figure 5: Continuation rate by care experience
Data population: Full-time UK-domiciled undergraduate students.
Source: OfS, ‘Differences in student outcomes: Further characteristics’, Annex B.12
Figure 5 is a double line graph showing the difference in continuation rate by care experience among full-time UK-domiciled undergraduate students between 2014-15 and 2017-18. It shows that, while there is still a substantial continuation rate between those who are care experienced and those who are not, it is narrowing.
It shows that:
- In 2014-15, 84.9 per cent of care experienced students continued to their second year compared with 92.4 per cent of students who were not care experienced, a difference of 7.5 percentage points.
- In 2015-16, 86.0 per cent of care experienced students continued to their second year compared with 92.4 per cent of students who were not care experienced, a difference of 6.4 percentage points.
- In 2016-17, 86.4 per cent of care experienced students continued to their second year compared with 92.5 per cent of students who were not care experienced, a difference of 6.1 percentage points.
- In 2017-18, 86.7 per cent of care experienced students continued to their second year compared with 92.3 per cent of students who were not care experienced, a difference of 5.6 percentage points.
It seems that care experienced students still need a smoother transition into higher education. This could include tuition support to help plug any educational gaps caused by school disruption. Access to mental health services is often important to ensure continuity of care. In a 2019 survey of care experienced students, 68 per cent of participants reported mental health difficulties while at university.13 Such difficulties could well have been exacerbated by the pandemic, since a high proportion of students in general have reported worsening levels of mental health and wellbeing.
The OfS aims to help improve outcomes for care experienced students through changes in culture and practice, and we are working to achieve this by a combination of regulatory pressure through access and participation plans and sharing of effective practice.
Case study: Go Higher West Yorkshire
Go Higher West Yorkshire is a partnership of 13 diverse higher education providers that seeks to reduce inequalities in higher education access, success and progression. The partnership considers local authorities to be key partners in widening participation; it is vital that providers work with them to develop evidence-based practice in the interests of care experienced young people.
As part of its ‘Care to Go Higher’ work strand, Go Higher West Yorkshire delivers an innovative training programme to equip adults to support the care experienced young people they live or work with to make informed choices about their educational progression. Foster carers, children’s home support workers and personal advisers across West Yorkshire are invited to attend six training sessions held on university and college campuses over six months.
The programme design is informed by several strategic principles:
- Equipping key influencers with high aspirations for care experienced young people alongside knowledge and experience to support them on the path to higher education.
- A contextualised approach to help key influencers understand the impact of experience of care on young people’s circumstances, needs and identity during their transition to higher education.
- Immersive outreach, welcoming community influencers into local higher education campuses to help establish a feeling of belonging and situate these spaces within communities’ sense of place.
Participants are introduced to the different types of higher education available on their doorstep and beyond, including college-based higher education and specialist providers as well as more traditional universities. The programme combines bespoke classroom-based learning with on-campus experience to inform first-hand perceptions and perspectives about the higher education experience and its value.
Funding for access and participation
Funding is a core part of the OfS’s work. It helps us to meet our regulatory objectives by driving improvements in student access, experience and outcomes. Student premium funding contributes towards the aims and objectives set out in providers’ access and participation plans or statements.
For the academic year 2021-22 we provided funding totalling £313 million for access and participation activity in providers across England, as follows:
- £40 million for the Uni Connect programme
- £40 million for the disabled students premium
- £67 million for the premium to support successful student outcomes for part-time undergraduates
- £154 million for the premium to support successful student outcomes for full-time undergraduates
- £23 million for the premium for student transitions and mental health.
The impact of deprivation and place
With the government’s ‘levelling up’ agenda, the importance of place and regional recovery are once again in the spotlight. Unemployment and productivity have long been recognised as regionally uneven, and the pandemic has exacerbated this trend.
Local lockdowns during the pandemic have impacted some areas more than others. Not all areas benefit equally from higher education. Coverage remains geographically uneven in England, and rural and seaside areas have limited access to higher education provision. We are learning from the ABCS data that 90 per cent of the most underrepresented population quintile consists of white students entitled to free school meals or living in low-participation neighbourhoods.14
We have also commissioned a dataset and interactive maps to support higher education providers, Uni Connect partnerships and other outreach providers in improving how they target their outreach interventions. The OfS contributed funding to the Higher Education Access Tracker to work with Aimhigher West Midlands and the East Midlands Widening Participation Research and Evaluation Partnership to produce data on outreach activities delivered at schools and further education colleges in England, and the number, type, contact hours and provider type of the outreach delivered at each school, between 2017-18 and 2019-20.15
Work with target groups and areas
The OfS funds and oversees a number of interventions to help ensure that where a person grows up does not limit their opportunities. These include Uni Connect, which involves 522 member organisations including colleges, universities, local organising bodies, charities, and employers, in 29 partnerships across England. Between August 2019 and July 2020, 186,000 target learners took part in at least one Uni Connect funded outreach activity, while 2,480 schools and colleges engaged in Uni Connect activity.16
Although it is still too early to assess the longer-term impact in terms of learners’ progression to higher education, evaluation of the programme has attested to the positive impact of this sustained and progressive approach to outreach on the most disadvantaged pupils, including on their confidence in making decisions about their course of study. In summer 2020, partnerships reported that 293,000 unique Uni Connect learners had engaged in sustained and progressive outreach activity since the launch of the programme in January 2017.17
The evidence from the Uni Connect evaluation increasingly indicates that approaches involving multiple interventions have a positive impact on short-, medium- and long-term outcomes for learners. Emerging evidence suggests more positive outcomes for those who participated in three to six hours per academic year, or seven or eight engagements over Years 12 and 13. These improve learners’ knowledge of higher education and contribute to higher levels of confidence. Sustained engagement in multiple-intervention programmes is found to have a positive impact on long-term outcomes, including the likelihood that a learner will successfully progress to higher education.18
A new approach to Uni Connect
This year we agreed to support the Uni Connect programme into a third phase, with a lower level of funding at £40 million. This will ensure that outreach with schools and colleges continues to be joined up, efficient and targeted, and delivered in a way that meets local priorities, equipping young and adult learners from underrepresented groups to make informed choices about higher education and helping to minimise the barriers they face. Phase three of the OfS-funded Uni Connect programme started in August 2021. It aims to:
- Contribute to reducing the gaps in higher education participation, by equipping young and adult learners from underrepresented groups to make informed choices about their options in terms of the full range of routes into and through higher education.
- Support a strategic local infrastructure of universities, colleges and other partners that can cut through competitive barriers, offer an efficient and low-burden route for schools and colleges to engage, and address outreach ‘cold spots’ for underrepresented groups.
- Contribute to a stronger evidence base around ‘what works’ in higher education outreach, and strengthen evaluation practice across the sector.
Phase three of the programme is scheduled to run through to the end of July 2025. Its funding is subject to confirmation and consultation on an annual basis.
As well as the various streams of data available through ABCS, the Higher Education Access Tracker and our new equality data, we will share our evaluations of success in this area through the Centre for Transforming Access and Student Outcomes in Higher Education (TASO).
All of these initiatives, including Uni Connect, will be reviewed and taken forward by the new Director for Fair Access and Participation when he joins us in the new year.
1 The Sutton Trust, ‘A-levels and university access’ (available at https://www.suttontrust.com/our-research/a-levels-and-university-access-2021/).
2 The Sutton Trust, ‘A-levels and university access’ (available at https://www.suttontrust.com/our-research/a-levels-and-university-access-2021/).
3 Education Policy Institute, ‘Analysis: A-level results 2021’ (https://epi.org.uk/publications-and-research/analysis-a-level-results-2021/).
4 OfS, ‘Evaluation of access and participation plan reforms’ (available at www.officeforstudents.org.uk/publications/evaluation-of-access-and-participation-plan-reforms/).
5 For the purposes of this analysis, we have assumed that the proportion of white students will remain constant, and so closing the gap will have been achieved by increasing the attainment rate of black students from 68.6 per cent to 77.3 per cent. An update to ‘Analysis of access and participation plan targets in relation to OfS key performance measures’ (available at www.officeforstudents.org.uk/publications/transforming-opportunity-in-higher-education/) will be published in early 2022.
6 Figures in this graph may differ from those given in the text, because the OfS analysis used data for a slightly different population. For further details see OfS 2020.06 and its accompanying technical analysis report.
7 OfS, ‘Equality, diversity and student characteristics data: Experimental statistics’ (www.officeforstudents.org.uk/data-and-analysis/equality-diversity-and-student-characteristics-data/experimental-statistics/).
8 OfS, ‘Equality, diversity and student characteristics data’ (www.officeforstudents.org.uk/data-and-analysis/equality-diversity-and-student-characteristics-data/experimental-statistics/).
9 OfS, ‘Associations between characteristics of students’ (www.officeforstudents.org.uk/data-and-analysis/associations-between-characteristics-of-students).
10 OfS, ‘Differences in student outcomes: Further characteristics’, (OfS 2020.30, available at www.officeforstudents.org.uk/publications/differences-in-student-outcomes-further-characteristics/), Annex B, p3.
11 National Network for the Education of Care Leavers, ‘Moving on up: Pathways of care leavers and care-experienced students into and through higher education’, November 2017 (available at https://www.nnecl.org/resources/23-nnecl-moving-on-up-report), pp27-28.
12 OfS, ‘Differences in student outcomes: Further characteristics’, Annex B, (OfS 2020.30, available at www.officeforstudents.org.uk/publications/differences-in-student-outcomes-further-characteristics/).
13 The University of Sheffield, The Leverhulme Trust, Economic and Social Research Council, ‘Pathways to university from care’ (available at https://figshare.shef.ac.uk/articles/report/Pathways_to_University_from_Care_Recommendations_for_Universities/9578930), p 6.
14 OfS, ‘Associations between characteristics of students’ (www.officeforstudents.org.uk/data-and-analysis/associations-between-characteristics-of-students).
15 OfS, ‘National outreach coverage project: targeting’ (www.officeforstudents.org.uk/advice-and-guidance/promoting-equal-opportunities/evaluation/national-outreach-coverage-project-targeting-tool/).
16 OfS, ‘Uni Connect annual report: Phase two (August 2019 to July 2020)’ (OfS 2021.22, available at www.officeforstudents.org.uk/publications/uni-connect-annual-report-phase-two/).
17 OfS, ‘Uni Connect annual report: Phase two (August 2019 to July 2020)’ (OfS 2021.22, available at www.officeforstudents.org.uk/publications/uni-connect-annual-report-phase-two/).
18 OfS, ‘Uni Connect annual report: Phase two (August 2019 to July 2020)’ (OfS 2021.22, available at www.officeforstudents.org.uk/publications/uni-connect-annual-report-phase-two/); OfS, ‘Uni Connect national evaluation: An analysis of young participation in higher education in England in the areas targeted by Uni Connect’ (OfS 2021.11, available at www.officeforstudents.org.uk/publications/uni-connect-national-evaluation/).
Describe your experience of using this website