Why are some white students left behind in relation to higher education participation, who are they and what help do they need?

These questions, and my attempts to answer them at the Education Select Committee earlier this month, made me think about Arthur Seaton, the anti-hero of Alan Sillitoe’s novel Saturday Night and Sunday Morning. ‘I’m me and nobody else,’ he says. ‘Whatever people say I am, that’s what I’m not.’
I might expect to hear this if I use the category ‘working–class’, given the complex mix of working and living patterns, income and wealth that now characterise English society. Or if I focus on students receiving free school meals, given the high rates of higher education entry by some in this group.
My dad was the same age as Seaton – 21 at the time of the 1960 film adaptation – and he loved the character, even though (perhaps because) his choices were quite different. While Seaton was working on the production line of the Raleigh factory in Nottingham, he was among those using education – and what Seaton calls the ‘propaganda’ from employers, churches, sports clubs and unions – to move on, in his case from school in Oldham to university in Hull.
Seaton’s attitude to hard work and merit provides a healthy challenge to any nostalgia you may be feeling for the ‘golden’ three decades of education-based social mobility following the Second World War, or indeed connections you may be making with your own position. So do the facts about higher education then and now. In the early 1960s, at the time of the Robbins review, there were around 200,000 full-time students in higher education, well under 10 per cent of the age cohort.
As a recent history of mass education in Britain has identified, there was already demand at this point from all types of families for their children to go on to higher education. A survey of 1962 found that ‘more than 80 per cent of working-class and middle-class parents wanted university for their children.’ These ambitions, coupled with successive governments’ belief in graduate human capital, has propelled growth to the level of 2 million students and around 50 per cent of the cohort in higher education today.
But some people and places have not benefited from this. As you can see below, the rate of progression into higher education for white British students who are eligible for free school meals is only 16 per cent. This compares with rates of 47 to 73 per cent for Asian students on free school meals and 32 to 59 per cent for black students in this category.
Proportion of pupils in England starting higher education by age 19 in 2018-19
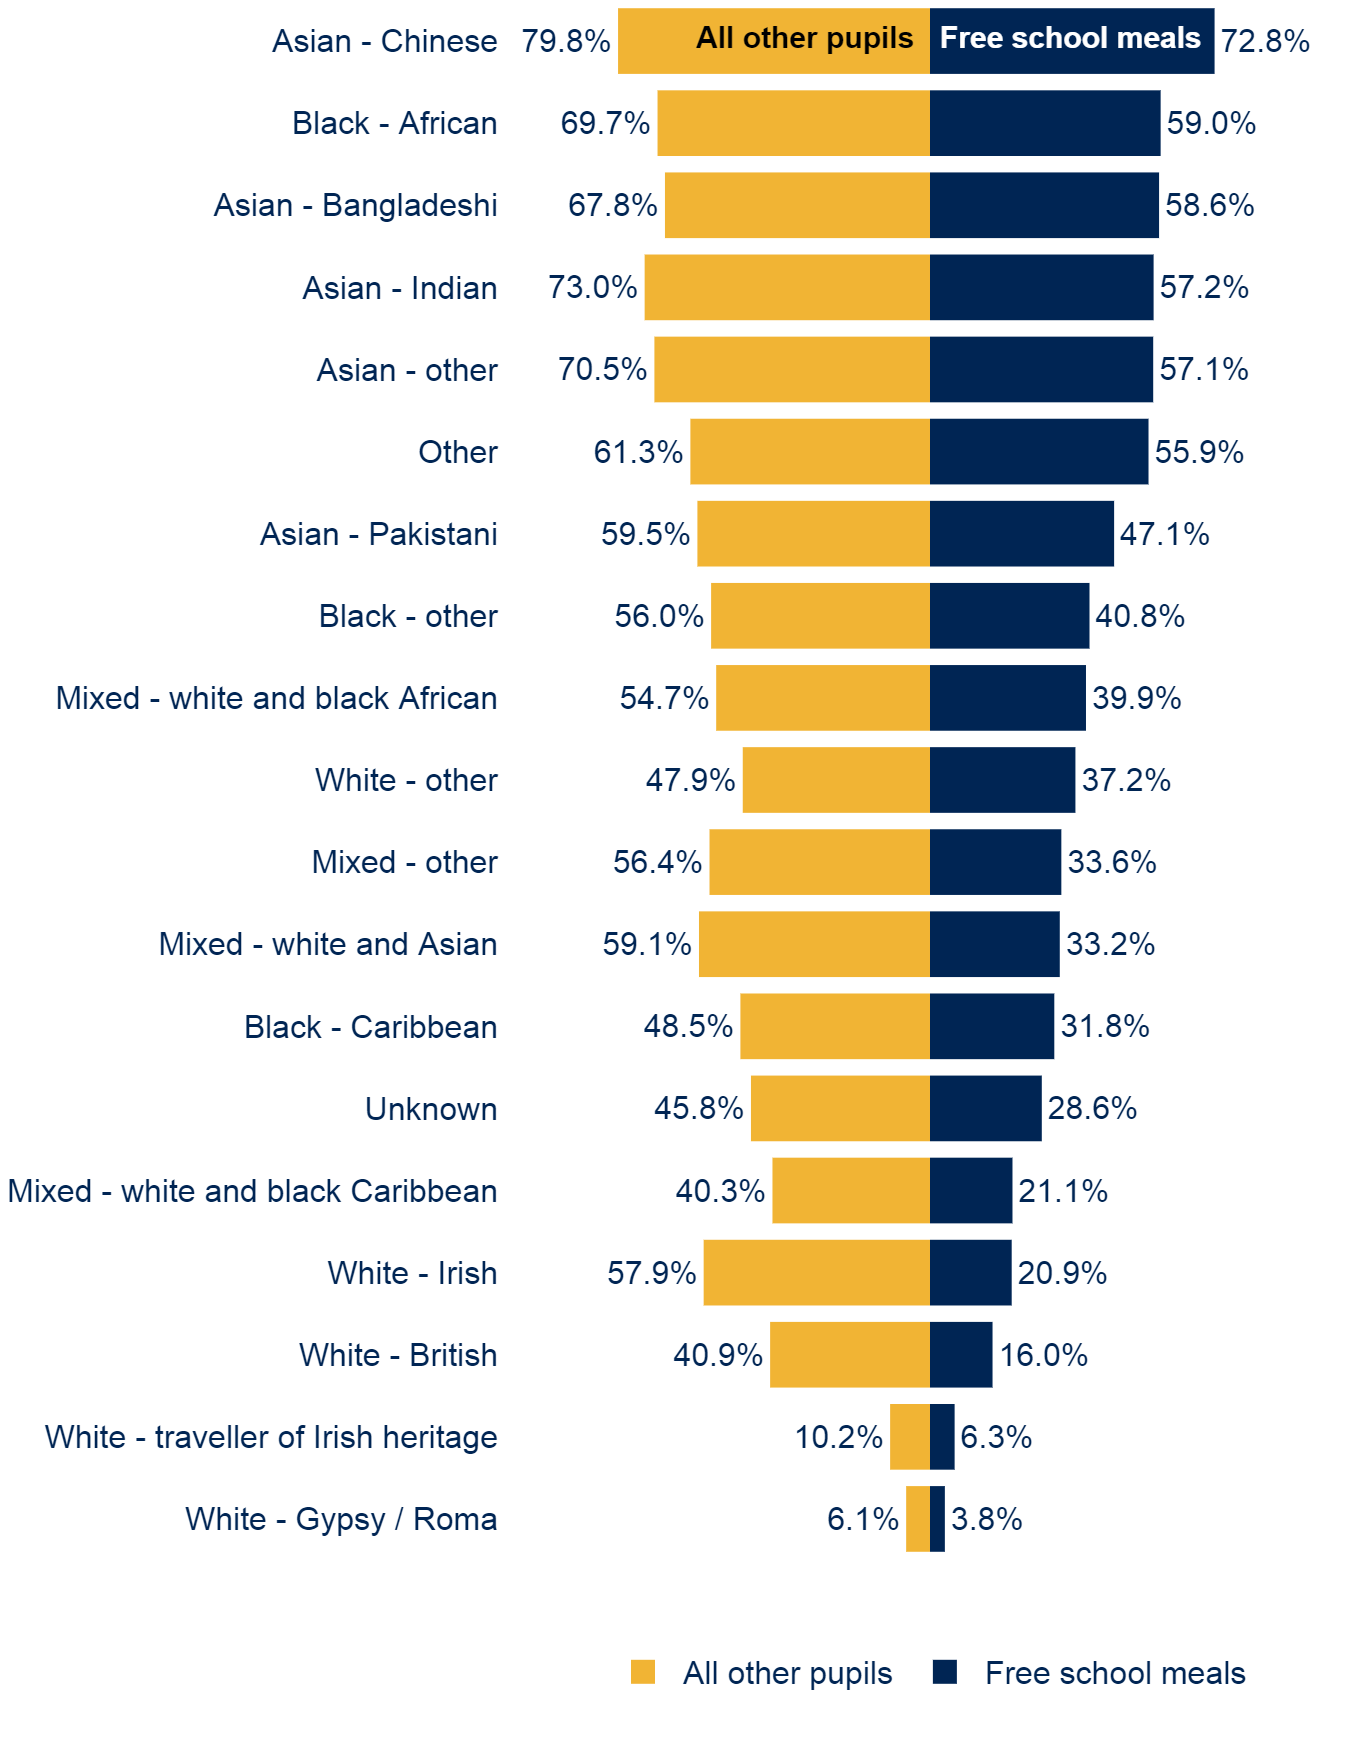
Source: Department for Education widening participation in higher education.
Free school meal entitlement gives us a proxy for relative poverty and this is an important factor for educational attainment and progression. As we have seen during the pandemic, the different levels of resources available for learning between families and schools have a profound effect on the ability to learn. The gap between the entry rates for white British students who are and are not eligible for free school meals is particularly large, at 25 percentage points.
But if you really want to understand the issue concerning the Select Committee, you need also to consider the influence of place. For white students who receive free school meals in London, the entry rate has pulled away from that in other parts of the country, and is now nearly eight percentage points higher than any other region (see below). In London, less than half of the population is white, compared with 80 per cent across England as a whole.
Proportion of white FSM pupils in England starting higher education by age 19 by region
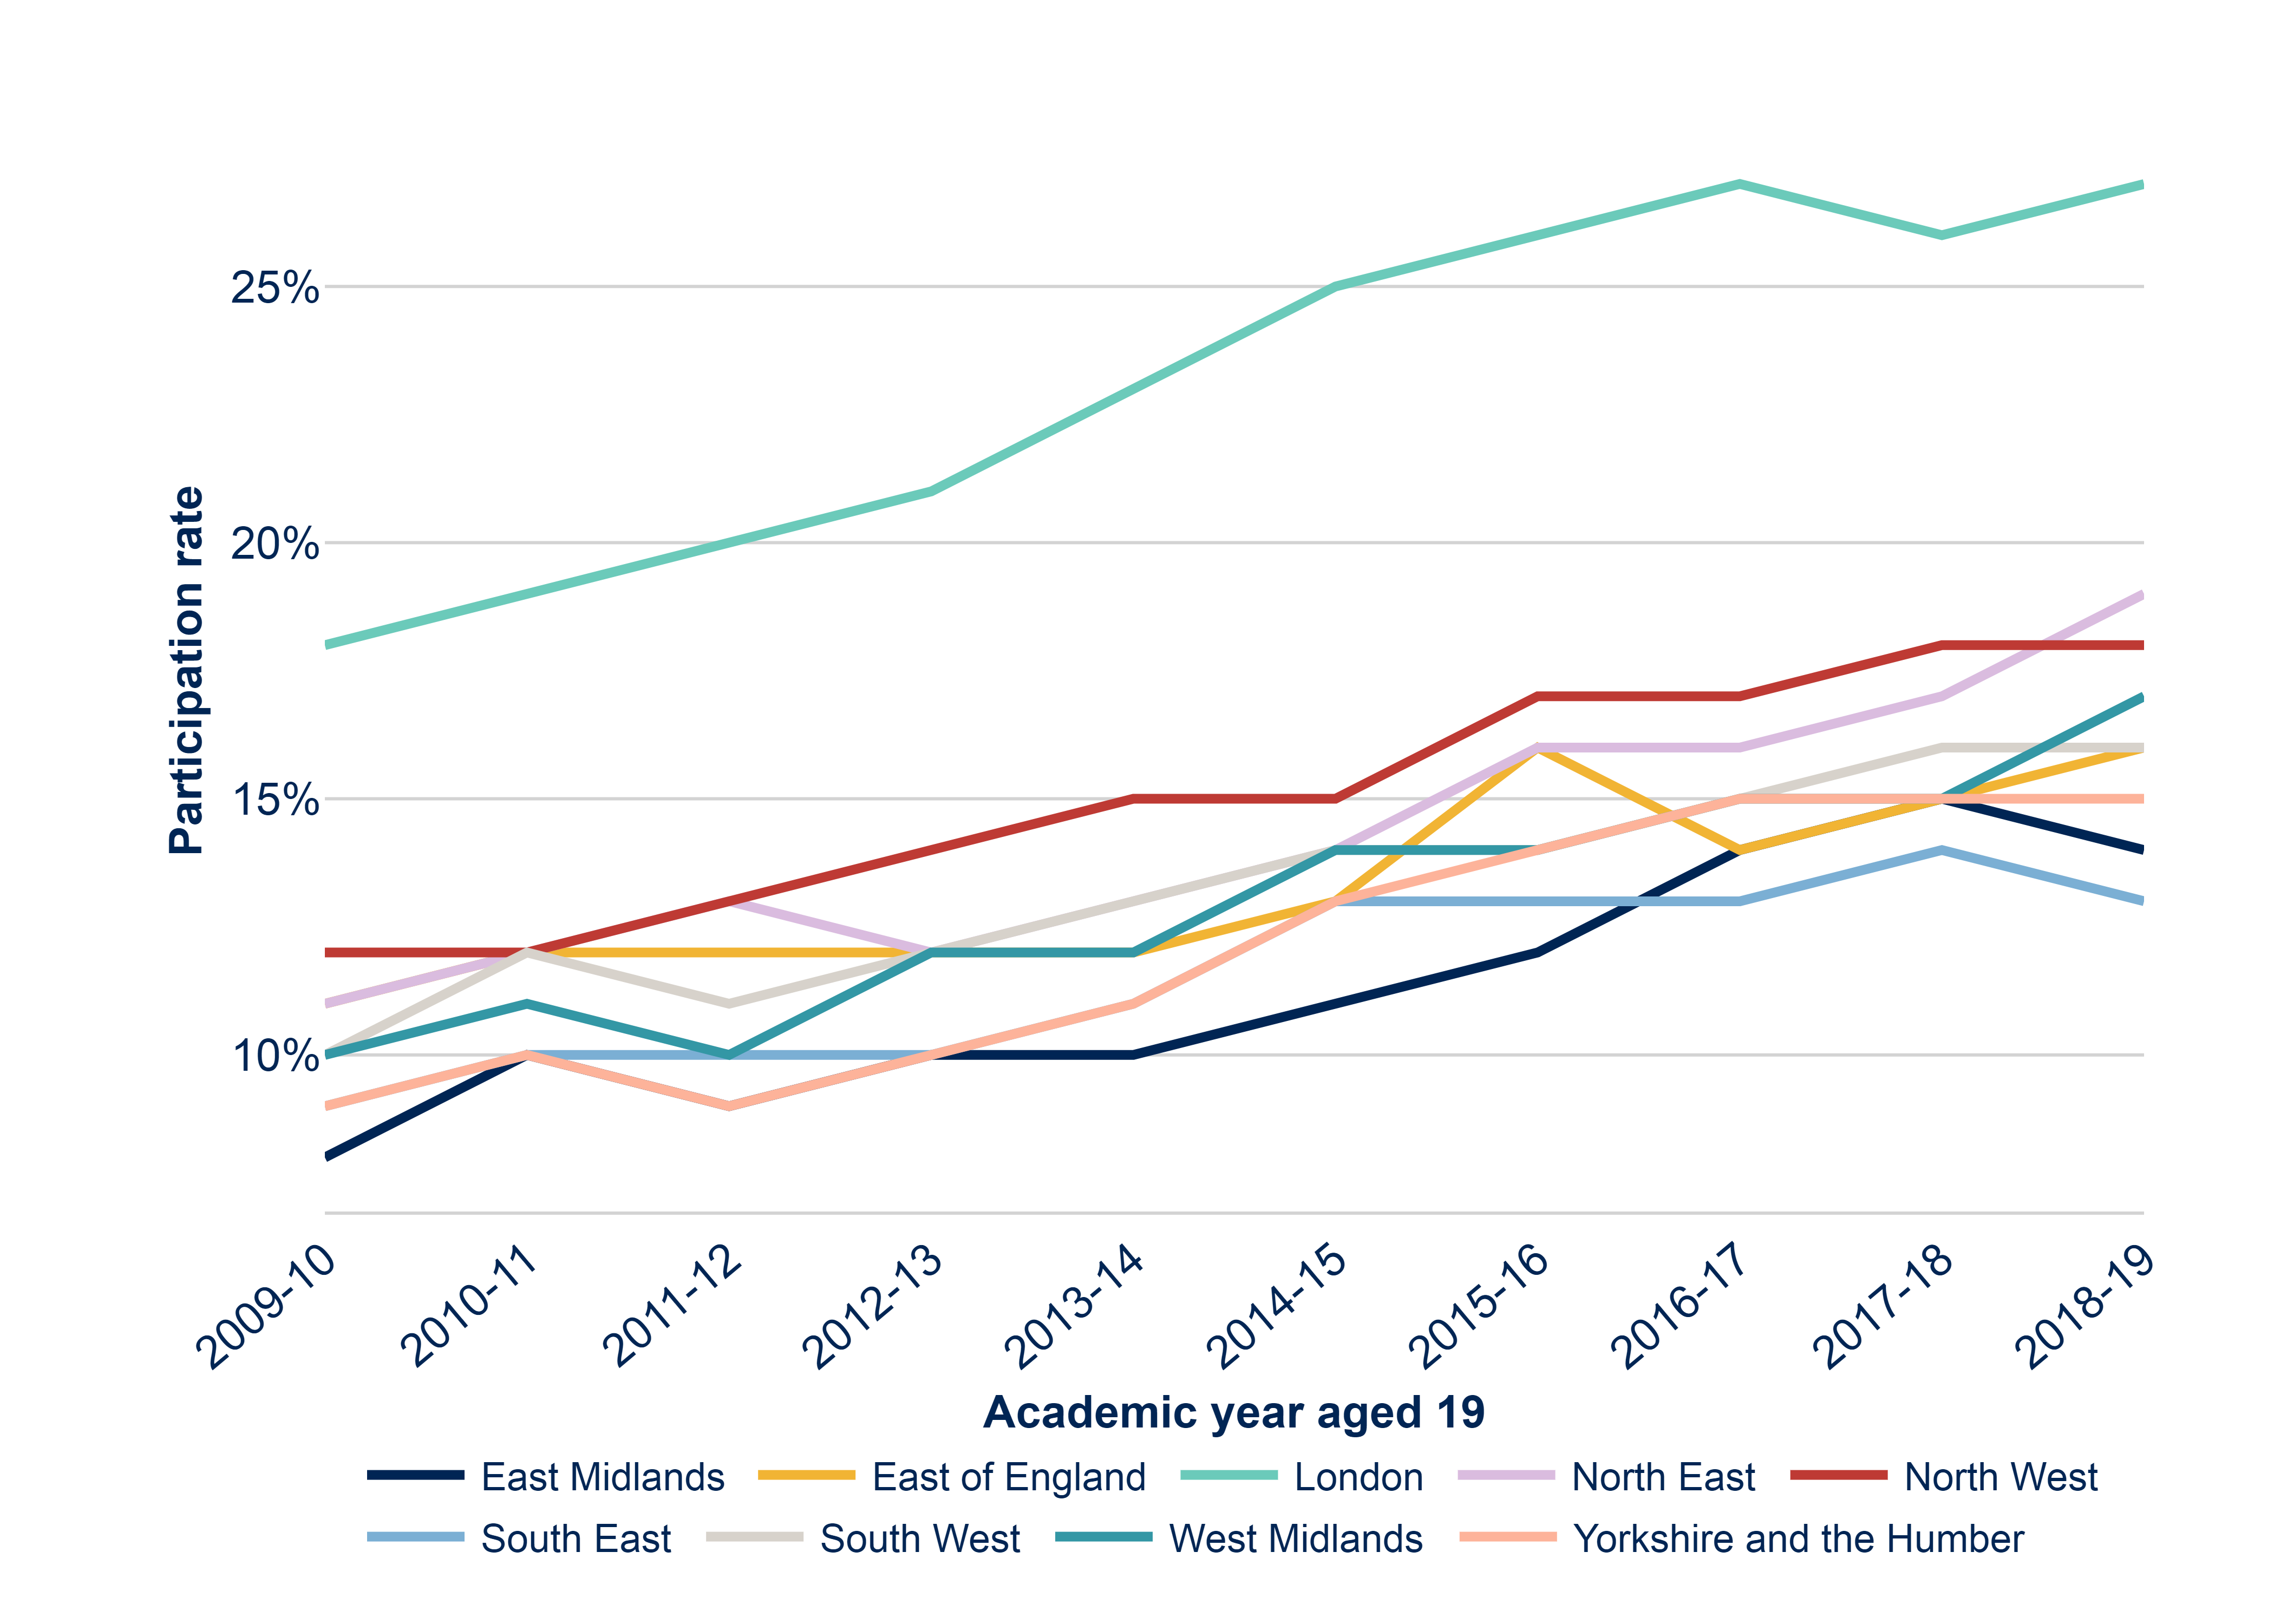
Source: Department for Education widening participation in higher education.
Returning to Nottingham, every postcode in the constituency of Nottingham North is in a low-participation neighbourhood. The same applies in Great Yarmouth, though the history and circumstances of these places are quite different. Virtually all of the lowest-participation neighbourhoods across England are in places like these: formerly industrial towns and cities across the north and midlands, or coastal towns.
Parliamentary constituencies with the highest proportion of postcodes in neighbourhoods with low higher education participation
| Parliamentary constituency | Number of postcodes in the constituency | Number of postcodes in POLAR4 quintiles 1 and 2 | Proportion of postcodes in low young higher education participation areas (POLAR4 quintiles 1 and 2) |
|---|---|---|---|
| Nottingham North | 1871 | 1871 | 100.0% |
| Barnsley East | 2507 | 2507 | 100.0% |
| Great Yarmouth | 2623 | 2623 | 100.0% |
| Sheffield, Brightside and Hillsborough | 1946 | 1855 | 95.3% |
| Kingston upon Hull East | 2043 | 1927 | 94.3% |
| Birmingham, Erdington | 1903 | 1794 | 94.3% |
| Stoke-on-Trent North | 2273 | 2124 | 93.4% |
| Boston and Skegness | 3434 | 3053 | 88.9% |
| Ashfield | 2229 | 1978 | 88.7% |
| Clacton | 2702 | 2361 | 87.4% |
Note: ‘POLAR’ = ‘Participation of Local Areas’
Using a new Associations Between Characteristics (ABCs) measure, the Office for Students (OfS) is identifying how the combination of factors such as race, poverty and place, together with other important influences such as gender, affects the likelihood of progression into higher education. Through this work, we have identified that 90 per cent of the students in the lowest-participation quintile using this measure are white British, and have either received free school meals or grown up in a low-participation neighbourhood (see data note below). These are the people and places that have been left behind. During 2021, we will be exploring how this new measure can improve support for the most underrepresented groups of students, which is regulated through the access and participation plans universities and colleges agree with the OfS.
Why are we seeing these patterns? The most important ingredient for higher education participation is the level of attainment in school. In areas where there are lower levels of attainment, you will often find higher levels of unemployment, ill health and poor housing, and lower household income.
But it is the experience across successive generations that perhaps distinguishes these communities from those with higher proportions of ethnic minorities, as in London. The expansion of educational opportunities, and the belief that equality of opportunity would flow from this, have not delivered for them. So they are less likely to see education as the way to improve their lives.
Research suggests that this is not about low aspirations or wanting any less for children; it is about expectations – a realistic assessment of the barriers to getting on. Schools can do a lot to shift expectations, but as recent focus groups have shown, people in left-behind towns feel the decline of local institutions and civic engagement – the ‘propaganda’ that used to help shape identity and ambitions.
The Social Mobility Commission has identified the need to join up educational interventions with other measures to improve local prosperity and it is now better placed to drive this across government through the Cabinet Office. As I have argued elsewhere, universities and colleges can bring this together in their local areas through the breadth of their subject interests, their relationships with businesses and public services, and their bridging of education and skills with research and development. This equips them to create pathways through all levels of education, both full-time and while in work, and for adults as well as young people.
The OfS-funded Uni Connect programme, which funds 29 partnerships of universities, colleges and local agencies across the country, supports this by engaging not only with pupils in schools and colleges, but also their parents.
Uni Connect programme: Helping young people to progress to further and higher education
Outreach North East
Future Me Enterprise Challenge has been developed in partnership with the football clubs in the North East region to inspire young men and increase their ambitions and skills to progress to higher education. Feedback from teachers highlighted an increase in students’ engagement and attainment in school, confidence in public speaking and an increase in those students now considering higher education. The partnership has also recruited and trained a team of parent and carer ambassadors who deliver information events and talks to parents from underrepresented groups to encourage and support them to help their children progress into higher education.
Higher Education Progression Partnership South Yorkshire
HE Can addresses the underrepresentation of young men from areas that have very low rates of participation in higher education. Ofsted has identified how it is raising the expectations of boys, enabling them to see the options open to them and equipping them with the confidence and knowledge to start making positive choices for their futures based on the belief that they can take the step into higher education. A parallel She Can programme to increase the confidence and resilience of girls is now underway.
Higher Horizons +
Stoking Curiosity is a festival co-organised by Keele and Staffordshire Universities for the communities of Stoke-on-Trent. Activities are delivered by academic staff together with community groups and businesses based in the area. Higher Horizons + supports a day exclusively for schools to access the festival. The partnership has also delivered with Stoke-on-Trent council a project that enables parents and learners to experience higher education together, through the creation of a film alongside a university student ambassador mentor. This is the first time many parents and carers have been to their local university and seen the facilities available, and has helped to address some previously negative perceptions of higher education.
Southern Universities Network
The Southern Universities Network based in Southampton has been conducting research to identify the barriers experienced by white boys in relation to their progression into higher education. In tandem with this, the network runs a Parent Hub. Aimed at the parents of young people aged 16 to 18, the hub helps answer the questions and concerns raised by parents and carers about their children’s next steps towards education and work.
Arthur Seaton figured in a sequel to Saturday Night and Sunday Morning in 2001, but Alan Sillitoe died in 2010, so we can’t know what happened to him. Given his age, I would like to think that he has just been given a coronavirus vaccine, perhaps at the Queen’s Medical Centre in Nottingham. He could then head over to the site of his old workplace and meet his grandchildren there, on the university campus that replaced it.
- The Associations Between Characteristics of Students (ABCS) identifies groups of students by how likely they are to access or continue in higher education based on a set of student characteristics.
- The following six characteristics are part of ABCS access: ethnicity (detailed breakdown); free school meal eligibility (FSM); sex; Income Deprivation Affecting Children Index quintile (an area-based measure); Index of Multiple Deprivation quintile (an area-based measure); and POLAR4 quintile (Participation of Local Areas, an area-based measure of the proportions of the young population who participate in higher education).
- All of these characteristics contribute to the ABCS Access quintile that an individual student belongs to. The table below shows the relationship for three of these characteristics, each one grouped for the purpose of understanding the relationship between white British FSM or POLAR4 quintile 1 pupils and access to higher education.
- The ABCS dashboard enables users to explore the relationship between other detailed ethnicities, and the other characteristics, to identify other combinations of characteristics that are also less likely to access higher education – for example, white and black Caribbean pupils, eligible for free school meals, living in POLAR4 quintile 1 areas, or the fact that men are more likely to be in ABCS access quintile 1 than women.
- The table shows that white British pupils, either eligible for free school meals or living in POLAR4 quintile 1 areas, are 91.6 per cent (32.4 per cent + 39.8 per cent + 19.4 per cent) of the ABCS Access quintile 1 (the fifth of pupils with the lowest rates of access to higher education). They are also more likely to belong to this group than would be expected on average (20 per cent of pupils from all backgrounds are in this group).
- The table also shows that pupils from other ethnic groups who are from POLAR4 quintile 1 areas are also more likely to belong to this group on average; they make up another 6.5 per cent of ABCS Access quintile 1.
- ABCS Access uses data from Department for Education’s National Pupil Database from the years in which pupils obtain their key stage four qualifications – most commonly GCSEs. We then look for these individuals in higher education records two or three years later – those with a matching record have accessed higher education.
| Ethnicity | Free school meals | POLAR4 | ABCS access quintile 1 pupils | All pupils (Key Stage 4 cohorts 2010-11 to 2014-15) | Proportion of pupils from this group in ABCS access quintile 1 | Proportion of pupils in ABCS access quintile 1 from this group |
|---|---|---|---|---|---|---|
| All | All | All | 553,090 | 2,766,655 | 20.0% | 100.0% |
| White – British | FSM | POLAR4 quintile 1 | 179,270 | 179,275 | 100.0% | 32.4% |
| POLAR4 quintiles 2-5 | 220,215 | 274,960 | 80.1% | 39.8% | ||
| not FSM (including unknown) | POLAR4 quintile 1 | 107,530 | 303,840 | 35.4% | 19.4% | |
| POLAR4 quintiles 2-5 | 80 | 1,345,130 | 0.0% | 0.0% | ||
| All other ethnic groups combined (including refused or unknown) | FSM | POLAR4 quintile 1 | 9,790 | 31,185 | 31.4% | 1.8% |
| POLAR4 quintiles 2-5 | 8,945 | 203,235 | 4.4% | 1.6% | ||
| not FSM (including unknown) | POLAR4 quintile 1 | 26,015 | 74,980 | 34.7% | 4.7% | |
| POLAR4 quintiles 2-5 | 1,250 | 354,055 | 0.4% | 0.2% |
Pupil numbers are rounded to the nearest five. Percentages are rounded to the nearest 0.1 per cent.
Source: Department for Education’s National Pupil Database. The Department for Education does not accept responsibility for any inferences or conclusions derived from the data by third parties.
Comments
Thank you Mike for sharing your story and insights, both as a student and a teacher. You are quite right to challenge on perceptions about higher education for everyone - the blog is not intending to advocate this. It is, though, aiming to highlight the level of inequality between white students eligible for free school meals and other students in relation to higher education participation, and the causes of that. Higher education will not be everyone, but it should be open to anyone who wants to experience it and is able to benefit from it, in the form and the time of life that works for them. I don't believe that this can apply to only 16% of white students who are eligible for free school meals.
3 Feb 2021 - 5:19PM
Thanks John (P), John (C), Michael and Jonathan for taking the time to read the blog and for your comments. I hope you are all well. Please do John (P) send me your research and perhaps one day we might be allowed to meet up on the Raleigh campus. You are quite right Jonathan to highlight the places within cities that have very low rates of HE participation. I tried in the blog to refer to 'parts of industrial cities' as well as towns. The interesting question is what are the common characteristics between those places, industrial towns and coastal towns. There is, I suspect, a common experience of the loss of jobs that had relatively high wages but did not require higher education, and loss of prosperity and civic institutions.
28 Jan 2021 - 2:54PM
First a bit of history. I grew up in a northern coastal town, attended a secondary modern school before transferring to grammar school at sixteen. I graduated from university in 1976 and spent 37 years as a teacher in both the independent and state sectors. As a Head of Sixth Form/Deputy Head for more than 20 years I was closely involved in university admissions. In summary, I count as a white working class lad who bucked the trend. Here are some reflections on the issue of participation among white working class lads. 1. Boys who attended Sec Mods were rarely encouraged to have ambitions beyond shipyard, mine or some skilled trade. Some of this mentality still pertains in the age of the comprehensive school. 2. Parental hopes and expectations were critical to a lad's chances of "getting on." Many parents were not especially ambitious for their children. What's more, if they were not quite poor enough to get a full grant for their child, they would be frightened off by the debt incurred in sending a lad to university. Although attitudes to debt have become more cavalier, there may still be many parents who dislike the idea of a heavy debt burden falling on their children. 3 The elephant in the room: why assume that university is the best route for these children? It is not self-evident to me that mass higher education has proved of benefit to the many thousands of additional students who have attained degrees or to UK plc. Significant numbers earn much less than they anticipated and are burdened with large debts. At the same time, skill shortages continue to blight the UK economy. Who is to say that an apprenticeship as an electrician, plumber, plasterer or bricklayer is not a much more rational choice than reading a social science degree at a former Polytechnic turned university? If only such apprenticeships were readily available. Incidentally, I am not unaware of the non-pecuniary benefits of a university education, especially if undertaken away from home. 4 Sorry to be off message, but in my view UK education policy took a wrong turning when it became a "mass" system.
28 Jan 2021 - 2:36PM
This is a really interesting, timely piece of work. I carry out research into the place and purpose of education, particularly secondary school education, in communities exactly like these, including Ashfield. I also work on the university campus where the Raleigh factory used to be. I would be very happy to discuss my research with you if you feel that would be of help.
27 Jan 2021 - 7:16AM
Thanks Chris - as a social geographer I sign up to every word of this. But I will not be the first to note the contradiction between last week's announcement of a £20m cut in UniConnect funding and the positive examples you cite.
26 Jan 2021 - 1:29PM
It's a serious challenge and our university makes a significant contribution to the 16% white British FSM quoted. Not least because we operate a very successful foundation year which addresses some of the inequalities arising from academic outcomes at secondary level, and we work closely with FE partners. How unfortunate that the good work of your office will be entirely undermined by other areas of mooted HE policy: as regards the future of foundation year courses, minimum entry tariff and worst of all the proposed Quality and Standards regime, which is de facto highly biased towards institutions with a high proportion of socioeconomically-advantaged students (whose graduate outcomes reflect lifelong advantage, not necessarily the quality of provision).
26 Jan 2021 - 11:02AM
An interesting article. The notion of left-behind towns is a powerful one, but does this fully describe what is happening in some of England’s larger cities? Several of the data examples quoted are in large cities, including Sheffield, where the Brightside & Hillsborough constituency borders the Sheffield Hallam constituency which lies to the SW and features very high participation rates. https://www.theguardian.com/education/2005/jan/19/highereducation.accesstouniversity1 Can a city be “left behind” and “connected” at the same time? The concept of inequalities between areas that are next to each other is an important aspect. By understanding what drives high participation could this help in understanding and addressing some of the barriers to this?
26 Jan 2021 - 10:49AM
Report this comment
Are you sure you wish to report this comment?