One size doesn’t fit all: Equality of opportunity for disabled students
Disabled students are entitled to expect the same experience and outcomes from higher education as their non-disabled peers. In practice this expectation is not always met.
This Insight brief sets out the differences in the attainment of disabled students, who include around a fifth of the undergraduate population. It also examines the qualitative differences in the experiences of disabled students, as reflected in the National Student Survey and elsewhere, including a new report. It summarises views gathered from universities and colleges about the issues they face in working to resolve these differences, and includes a checklist of points for them to consider. It does not constitute legal or regulatory advice.
- Date:
- 14 October 2025
Read the brief
Download the Insight brief as a PDF
Get the data
Download the Insight brief data
Student voice tracking study
Read the report by Savanta for the Office for Students
Read the Insight brief online
Introduction
Disabled students deserve to gain the same fulfilment and value from higher education as their non-disabled peers. The Office for Students (OfS) aims to ensure that students from all backgrounds benefit from high quality higher education. In this capacity we work with universities and colleges to improve disabled students’ experiences.1
We are publishing this Insight brief to highlight the inequalities between disabled and non-disabled students, and to encourage institutions to reflect on how they can improve disabled students’ experiences of higher education. The brief includes a checklist of points for universities and colleges to consider when reviewing their support for disabled students. It showcases new data on these students, and the findings from workshops we held with representatives from universities and colleges about their experiences of implementing reasonable adjustments for disabled students. We also reflect on good practice and examples of work being done to improve the experiences of disabled students in higher education.
The brief draws on the work of our Disability in Higher Education Advisory Panel, established in April 2024 to improve the experiences of disabled students in higher education, and to provide us with insight and guidance.2 The panel includes independent members who offer expertise in higher education leadership or leadership in disability policy, and student and graduate members who represent the perspectives of past, present and future disabled students. One of its goals is to identify areas where our evidence for the experiences of disabled students is lacking, and to support us in filling in the blanks.
Points for universities and colleges to consider
- Do you know what the law says about reasonable adjustments in higher education? Have you considered the information shared by the Office of the Independent Adjudicator for Higher Education and the Equality and Human Rights Commission about how to apply the Equality Act 2010 for students?
- Does your university or college have a whole-institution approach to responding to the needs of disabled students? Is there accountability for this at a senior level?
- Are you using the OfS Equality of Opportunity Risk Register to consider the risks to equality of opportunity that disabled students face and how you might address these within your own institution?
- Is there staff training on the support needs of disabled students? Does it cover the different responsibilities of a range of staff roles, for instance academic staff for reasonable adjustments and inclusive assessment methods, and estates teams for physical accessibility?
- Do you use data on disabled students to plan and deliver effective support? How many disabled students apply to and study at your institution? What do National Student Survey results and student outcomes data reveal about their experiences?
- Are you working with and listening to disabled students and student representatives at your university or college to improve the experiences of disabled students? Do you have a way of engaging with disabled students on a regular basis, such as a disabled students’ voice group?
- Do you make sure that the support you offer disabled students is personalised and responds to individual needs? How does it take into consideration the impact of a student experiencing multiple forms of disadvantage (for example, being disabled and from a low-income household)?
- Is your communication with students about reasonable adjustments clear and timely? Do students know what reasonable adjustments are and how to apply for them? Are they given information about these and other disability support before they start their higher education studies?
- Do you share information about reasonable adjustments across your institution? Is there an effective system that requires a student to share their information only once, and then facilitates the sharing of information about their implementation?
- Do you have a process in place for students to raise issues if their support isn’t meeting their needs or hasn’t been implemented properly?
- Do you have a system of routinely evaluating the effectiveness of individual reasonable adjustments as well as your approach across your institution? How do you ensure that hearing from disabled students is at the centre of any evaluation?
- Do you ensure that teaching and assessments are accessible for disabled students, while maintaining their rigour and credibility? Are you ensuring that your identification and assessment of competence standards is robust and consistent with the approach set out by the Equality and Human Rights Commission?
Definitions
The Equality Act 2010 defines a person as disabled if that person has a physical or mental impairment that has a substantial and long-term adverse effect on their ability to carry out normal day-to-day activities.3
The Act places a legal duty on universities and colleges to make reasonable adjustments for disabled students.4 These are steps taken by the university or college to remove a substantial disadvantage to a particular student that results from its systems. They can be changes to practices or to the built environment, or providing auxiliary aids or services. They do not apply to competence standards that form an essential part of a course. Adjustments that would be highly impractical or prohibitively expensive are not considered reasonable.
A learning support plan (sometimes known by other names such as a ‘statement of reasonable adjustments’) is a document that outlines the needs of a disabled student and the support or adjustments agreed by the university or college. It is usually developed in discussion with the student, and should help to inform relevant staff about how they can support the student in their studies.
Inclusive practice in higher education refers to an approach to the design of courses and assessment that considers the needs of all students, including those who are disabled or are from disadvantaged backgrounds. An example is Universal Design for Learning.5 The aim is to create learning environments and assessment methods that are accessible to all and thereby decrease the need for individual adjustments. It is not a legal requirement for universities and colleges to adopt an inclusive practice approach.
What does the data tell us?
The disabled student population
In 2023-24, 19.9 per cent of full-time undergraduates, 24.6 per cent of part-time undergraduates and 17.5 per cent of undergraduate degree apprentices reported at least one disability.6 Some students have multiple impairments, each of which may contribute to their needs for support.
Population and outcomes data is available on our data dashboards for student groups in higher education, such as postgraduate students. For example, in 2023-24, 17.5 per cent of full-time postgraduate research students and 7.2 per cent of postgraduate taught masters’ degree students had a reported disability.7
When reviewing this data, it is important to bear in mind that the question the Higher Education Statistics Agency asks universities and colleges when collecting student data is:
‘Do you have an impairment, health condition, or learning difference that has a substantial impact on your ability to carry out day-to-day activities and has lasted, or is expected to last, at least 12 months?’8
These numbers therefore only represent students with impairments or health conditions they feel meet this definition. Some, for instance those who don’t have a diagnosis, may not be clear whether their condition meets the threshold.
The numbers may also be affected by underreporting, since a student may choose not to share information about a disability with their university or college. The data also represents a wide range of disabilities and every student’s support needs will be individual to them. If students report having more than one disability, or a disability that does not fit the categories listed, this is recorded as ‘multiple or other impairments’. It is not possible to see which types of disabilities these include. When interpreting the data in this brief it is important to also bear in mind that disabled students can also experience multiple forms of disadvantage: for instance, being disabled and from a low-income household, or being disabled and being in a minority ethnic group. Other forms of disadvantage may also have an impact, for example, on whether a disabled student goes to university or continues with their course.
Table 1 gives information on the proportion of student entrants with different types of reported disability.
Table 1: Percentage of undergraduates in higher education with a reported disability in 2023-24
| Type of disability | Percentage of full-time undergraduates | Percentage of part-time undergraduates | Percentage of undergraduate degree apprentices |
|---|---|---|---|
| Cognitive or learning difficulties | 5.9 | 4.9 | 8.3 |
| Mental health condition | 5.5 | 7.2 | 2.2 |
| Multiple or other impairments | 5.0 | 7.4 | 3.7 |
| Sensory, medical or physical impairments | 2.4 | 3.7 | 2.5 |
| Social or communication impairment | 1.0 | 1.3 | 0.7 |
| No disability reported | 80.1 | 75.5 | 82.5 |
Source: OfS student characteristics data.9
Disabled students’ outcomes
Student outcomes
Continuation rate: The proportion of entrants who were continuing to study a higher education qualification (or who had gained a qualification) one year and 15 days after they started their course (two years and 15 days for part-time students).
Completion rate: The proportion of entrants who gained a higher education qualification (or were continuing in the study of a qualification) four years and 15 days after they started their course (six years and 15 days for part-time students).
Attainment rate: The proportion of undergraduate qualifiers who achieve a first or upper second class grade.
Progression rate: The proportion of qualifiers who identify managerial or professional employment, further study, or other positive outcomes among the activities they were undertaking at the Graduate Outcomes survey census date, 15 months after they left higher education.
Because of how each outcome is measured, the latest available data in each case relates to different cohorts of students.
As Figure 1 shows, the latest completion and progression rates for full-time undergraduates with a reported disability are lower than those for their non-disabled peers. The gaps are -2.1 percentage points for completion (for academic year of entry 2019-20) and -1.0 percentage points for progression (for year of qualification 2022-23). For continuation (year of entry 2022-23), the rate is slightly higher among those who have reported a disability (a difference of 1.1 percentage points). For attainment (year of qualification 2023-24), full-time undergraduates with a reported disability have a rate 2.0 percentage points higher than those without.
Figures 2 and 3 show a different picture for part-time undergraduates, as well as for undergraduate degree apprentices. For these students, the latest available outcome rates are lower for those with a reported disability than for those without, for all four outcomes. The largest gap for part-time undergraduates is for completion (year of entry 2017-18), where those with a reported disability have a rate 13.0 percentage points lower than their non-disabled peers. In the case of undergraduate apprentices the largest gap, of 5.0 percentage points, is for attainment (year of qualification 2023-24). It is worth noting that a higher proportion of part-time undergraduates are disabled than their full-time peers.
Figure 1: Student outcomes data for full-time undergraduates with and without a reported disability
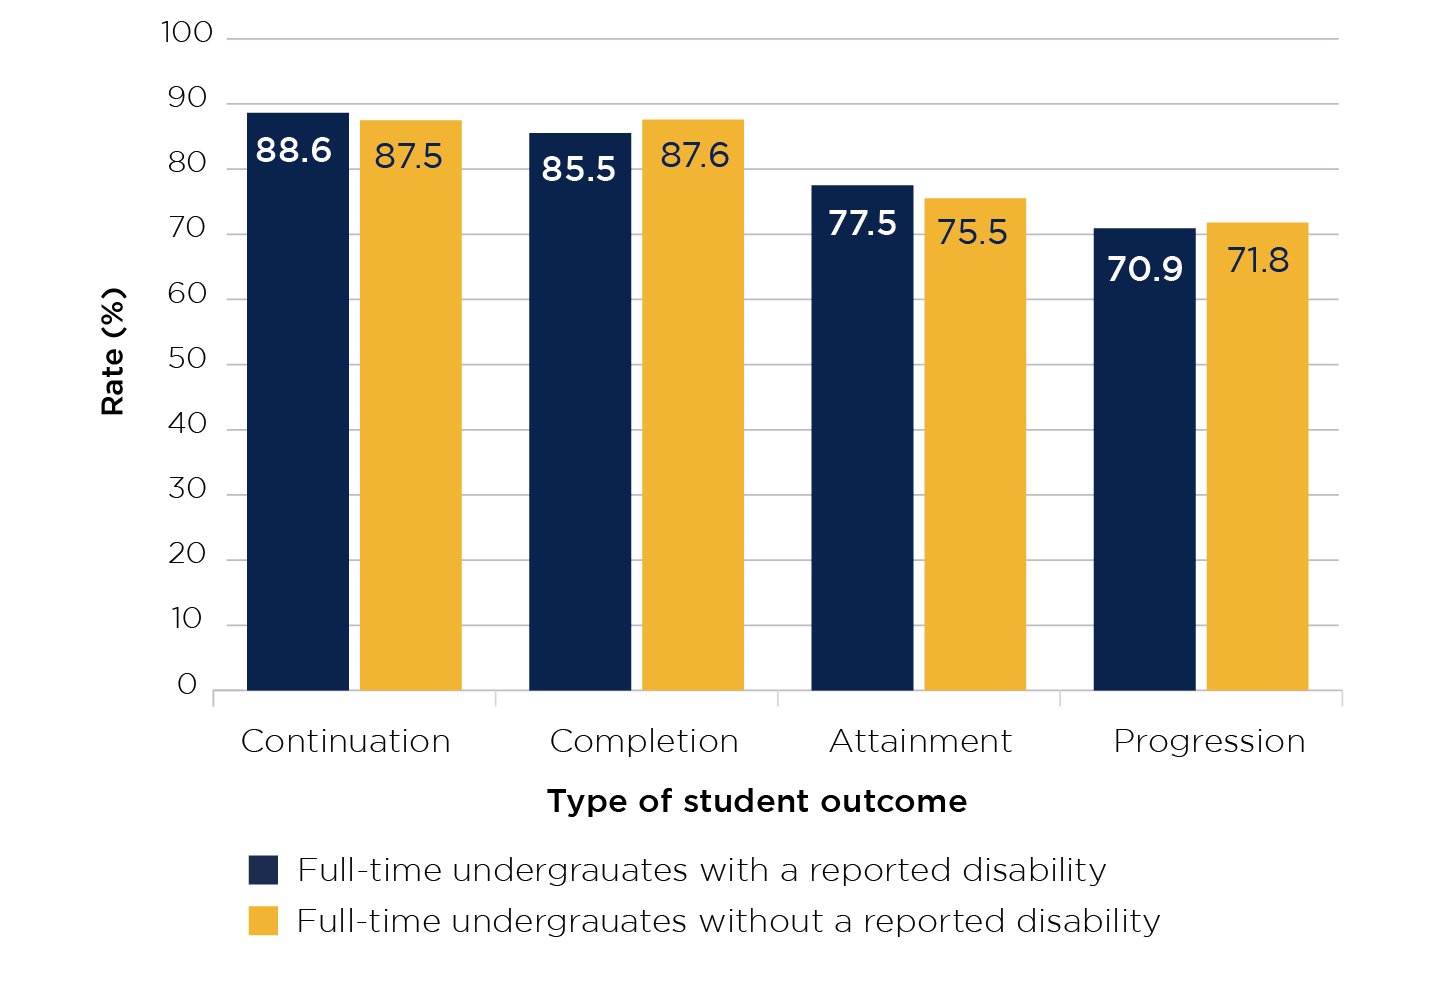
Source: OfS student characteristics data.10 (Continuation: year of entry 2022-23. Completion: year of entry 2019-20. Attainment: year of qualification 2023-24. Progression: year of qualification 2022-23.)
The bar chart shows the continuation, completion, attainment and progression rates for full-time undergraduates with and without a reported disability. The Y axis shows the rate as a percentage and the X axis shows the type of student outcome (continuation, completion, attainment and progression).
The continuation rate for full-time undergraduates with a reported disability is 88.6 per cent and for full-time undergraduates without a reported disability is 87.5 per cent.
The completion rate for full-time undergraduates with a reported disability is 85.5 per cent and for full-time undergraduates without a reported disability is 87.6 per cent.
The attainment rate for full-time undergraduates with a reported disability is 77.5 per cent and for full-time undergraduates without a reported disability is 75.5 per cent.
The progression rate for full-time undergraduates with a reported disability is 70.9 per cent and for full-time undergraduates without a reported disability is 71.8 per cent.
Figure 2: Student outcomes data for part-time undergraduates with and without a reported disability
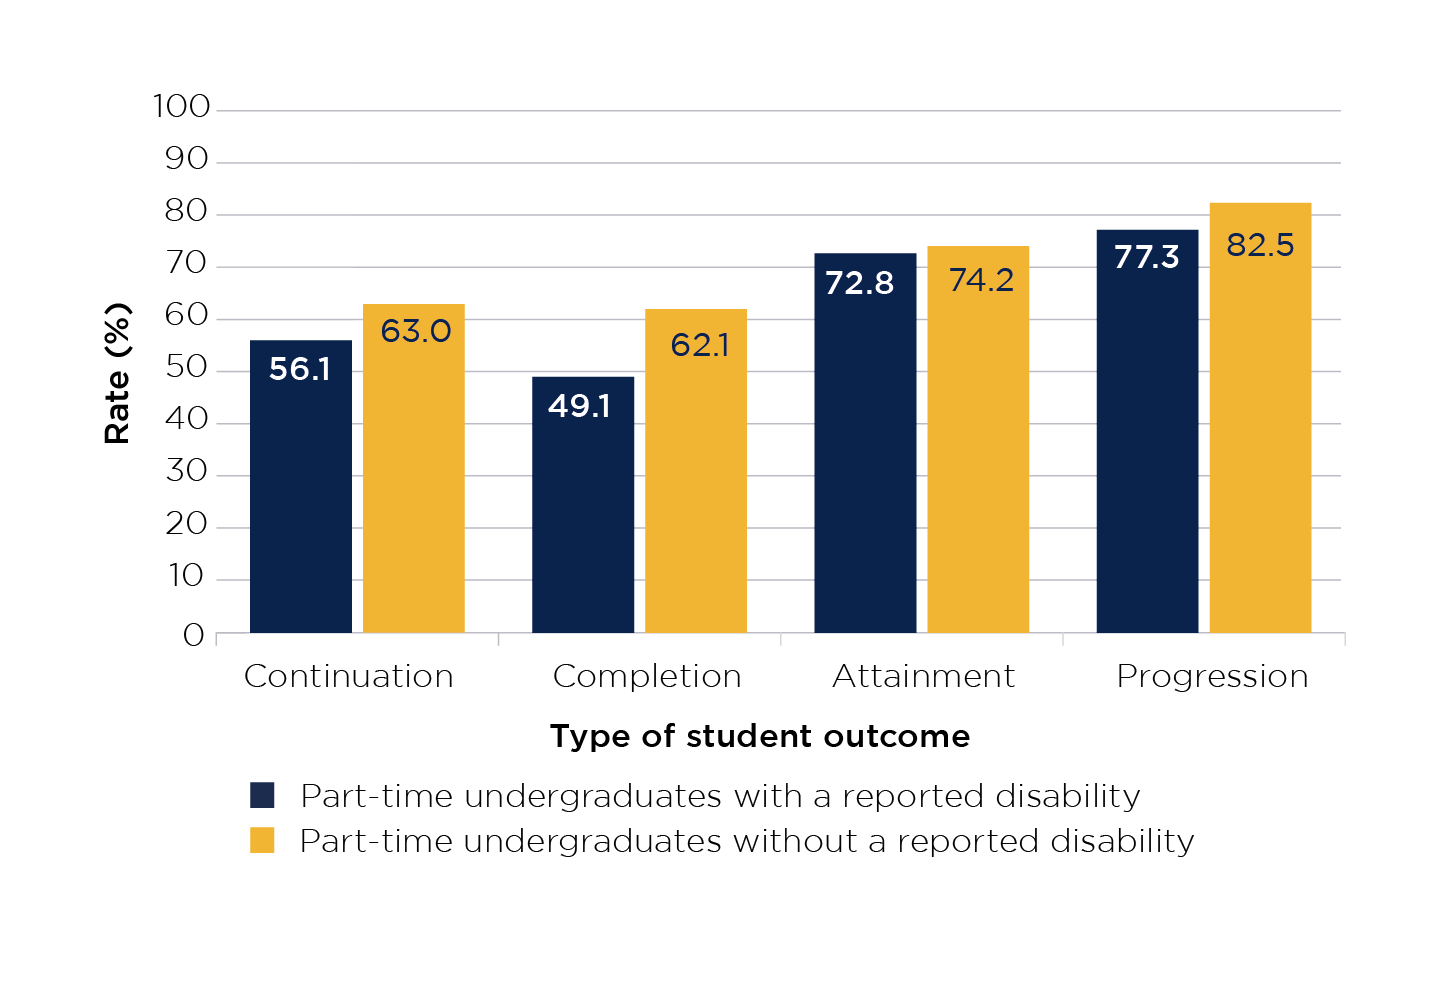
Source: OfS student characteristics data.11 (Continuation: year of entry 2021-22. Completion: year of entry 2017-18. Attainment: year of qualification 2023-24. Progression: year of qualification 2022-23.)
The bar chart shows the continuation, completion, attainment and progression rates for part-time undergraduates with and without a reported disability. The Y axis shows the rate as a percentage and the X axis shows the type of student outcome (continuation, completion, attainment and progression).
The continuation rate for part-time undergraduates with a reported disability is 56.1 per cent and for part-time undergraduates without a reported disability is 63.0 per cent.
The completion rate for part-time undergraduates with a reported disability is 49.1 per cent and for part-time undergraduates without a reported disability is 62.1 per cent.
The attainment rate for part-time undergraduates with a reported disability is 72.8 per cent and for part-time undergraduates without a reported disability is 74.2 per cent.
The progression rate for part-time undergraduates with a reported disability is 77.3 per cent and for part-time undergraduates without a reported disability is 82.5 per cent.
Figure 3: Student outcomes data for undergraduate degree apprentices with and without a reported disability
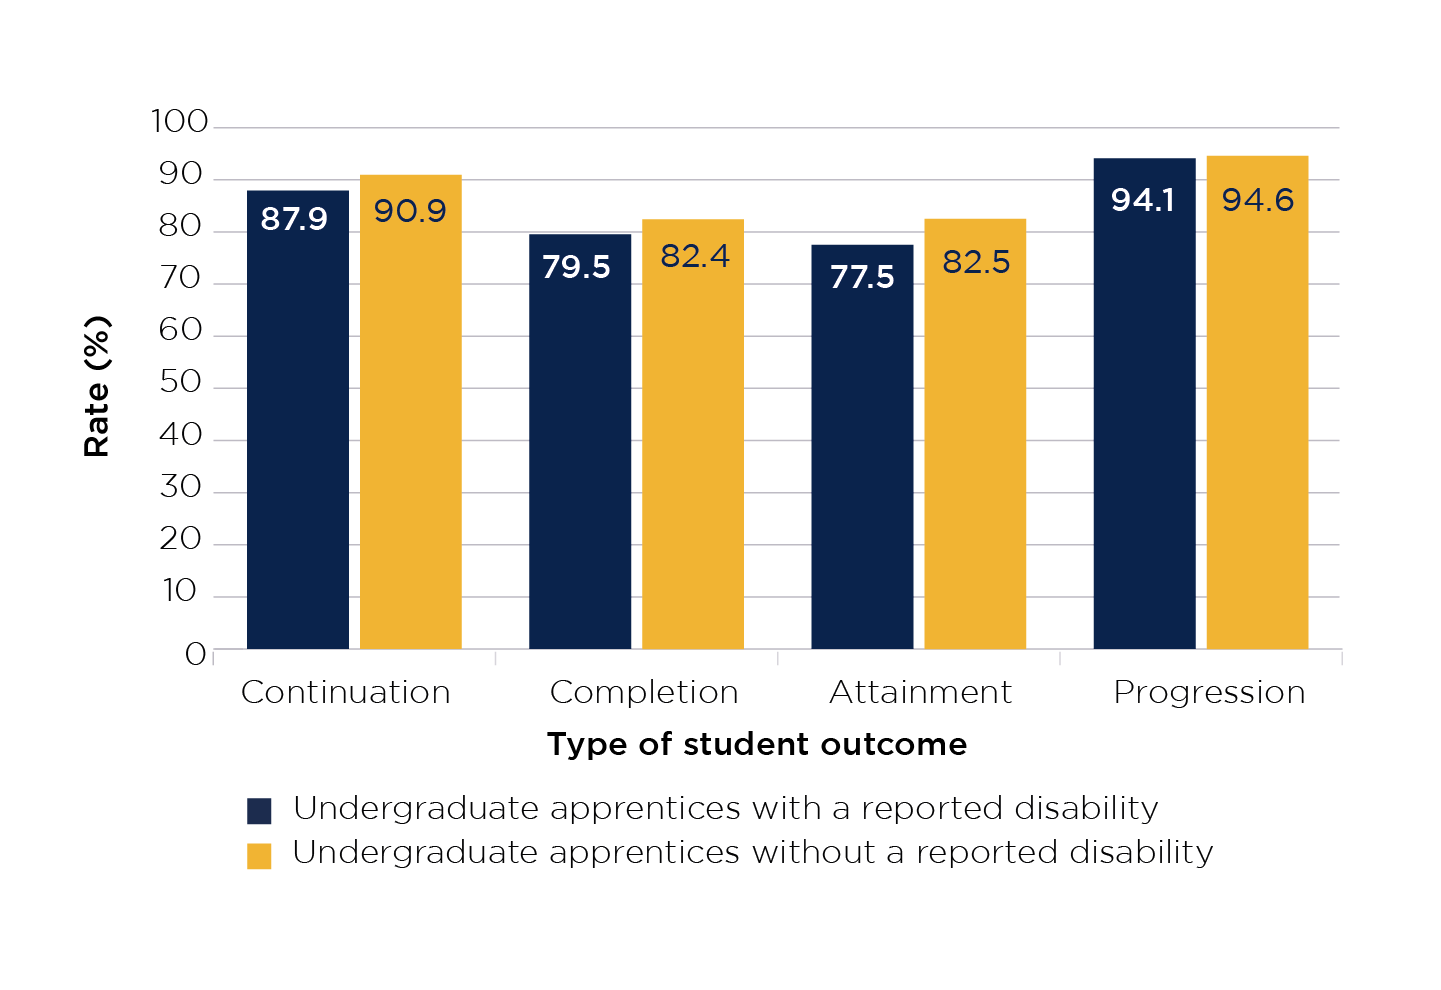
Source: OfS student characteristics data.12 (Continuation: year of entry 2022-23. Completion: year of entry 2019-20. Attainment: year of qualification 2023-24. Progression: year of qualification 2022-23.)
The bar chart shows the continuation, completion, attainment and progression rates for degree apprentices with and without a reported disability. The Y axis shows the rate as a percentage and the X axis shows the type of student outcome (continuation, completion, attainment and progression).
The continuation rate for degree apprentices with a reported disability is 87.9 per cent and for degree apprentices without a reported disability is 90.9 per cent.
The completion rate for degree apprentices with a reported disability is 79.5 per cent and for degree apprentices without a reported disability is 82.4 per cent.
The attainment rate for degree apprentices with a reported disability is 77.5 per cent and for degree apprentices without a reported disability is 82.5 per cent.
The progression rate for degree apprentices with a reported disability is 94.1 per cent and for degree apprentices without a reported disability is 94.6 per cent.
This data does not at first sight suggest that full-time disabled students are encountering significantly worse outcomes than their non-disabled peers. However, it is important to consider evidence about the qualitative experiences of students while at university, which student outcomes data cannot capture.
Disabled students’ experiences
Evidence from the National Student Survey and from recent reports by Disabled Students UK and the Office of the Independent Adjudicator for Higher Education (OIA) underlines the need for renewed effort by universities and colleges to address the comparatively poor experience of many disabled students. This evidence also suggests that opportunities to support these students are being missed.
Disabled Students UK’s 2024 Access Insights Report (presenting findings from the Annual Disabled Student Survey completed by more than 1,200 students) found that only 38 per cent of students who had declared their disability to their university or college reported having the support and adjustments they need to be able to access their studies on equal terms with their non-disabled peers.13 It estimates that only two-thirds of disabled students choose to declare their disability to their university or college. It also notes that 65 per cent of disabled students have more than one type of impairment. It suggests that most hold back from raising access issues with their university or college, and highlights that they normally need to declare their disability multiple times to different parties.
The OIA has noted that disabled students are overrepresented in its caseload. In 2023 about one-third of the complaints the adjudicator dealt with were from disabled students, while in 2024 the figure was just over 40 per cent. Furthermore, the OIA’s 2023 annual report notes that a higher proportion of disabled than non-disabled students had their complaints fully or partially upheld.
The OIA’s 2024 annual report suggests that students with mental health issues are less likely to take up the support available to them, whether because the extent of their struggling is unclear to them, because it seems overwhelming or because of stigma.
The same report suggests that, based on the complaints the OIA receives, events that occur because a student is disabled are likely to have a significant and lasting impact. Often these complaints related to the implementation of support and of reasonable adjustments to teaching and assessment, or to delays in the application process for the Disabled Students’ Allowance. The report notes some improvements to recent practice, including reducing repeated requests for evidence of conditions, applying self-certification policies for students like those used for staff, and better communication. It calls for greater accountability in ensuring that disabled students are placed on an equal footing with their non-disabled peers, and for better resourcing of support for disabled students.14
National Student Survey
The results of the National Student Survey (NSS), the annual survey of all final year undergraduate students in the UK, consistently suggest that the experiences of disabled students fall behind those of their peers who did not declare a disability.15 While overall positivity in the 2025 NSS has mostly increased compared with 2024, in every theme the positivity measure of disabled students is lower than that of non-disabled students.16
Themes in the NSS
NSS questions are grouped into seven themes:
- Teaching on my course
- Learning opportunities
- Assessment and feedback
- Academic support
- Organisation and management
- Learning resources
- Student voice.
Respondents to the NSS
In England, 71.4 per cent overall of students eligible in 2025 responded to the NSS. The response rate for students with a reported disability was 72.9 per cent, and for those without it was 71.1 per cent. NSS data only covers undergraduate, not postgraduate, students. It also only captures the experiences of students who have continued to their final year of study, and will not therefore be representative of the experiences of all disabled students, particularly those who do not complete their courses.
NSS benchmarking
We construct benchmarks for each theme and question, based on responses from across the higher education sector, and adjusted based on the characteristics of the group we are interested in – in this instance, disabled students. This benchmark then predicts what the NSS results for the sector would have been, if it had the same breakdown of students and subjects as the population of disabled students. In this instance this helps to understand whether the reason the positivity measure for disabled students is higher or lower is likely to be because they are disabled, rather than because of other characteristics they might tend to share.17
The gaps between positivity measures for disabled and non-disabled students in England, shown in Figure 4, are larger than those for different ethnic groups or quintiles of deprivation. They range from 1.7 percentage points in Theme 1, ‘Teaching on my course’ (where disabled students are 1.4 percentage points from their benchmark), to 7.5 percentage points in Theme 5, ‘Organisation and management’ (3.9 percentage points from the benchmark).18
Figure 4: Positivity measures from the NSS 2025 for disabled and non-disabled students, with benchmark for disabled students
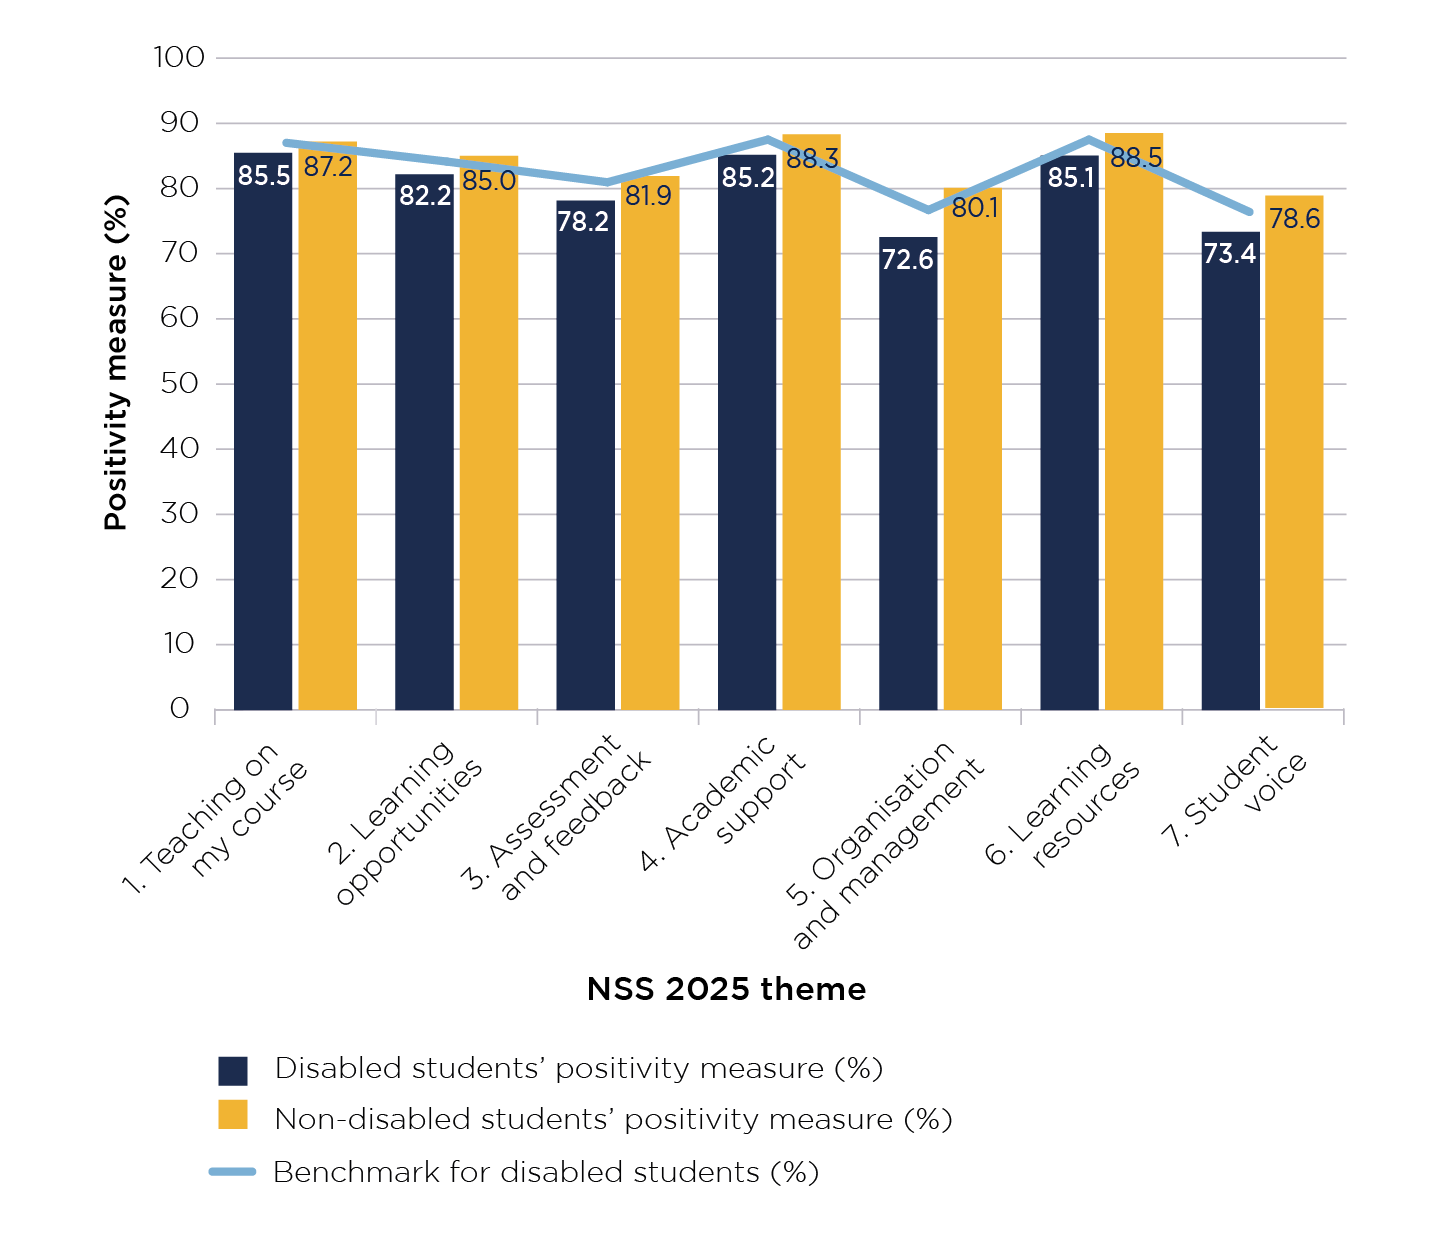
Source: OfS, ‘National Student Survey 2025 data: Student characteristics data’.19 See the text for an explanation of how the benchmark is constructed.
This bar chart shows the positivity measures for different themes from the National Student Survey (NSS) 2025 for disabled and non-disabled students. The Y axis shows the positivity measure as a percentage and the X axis shows different NSS 2025 themes. There is a line in the chart showing the benchmark for disabled students.
For theme 1: Teaching on my course, the NSS 2025 positivity measure for disabled students was 85.5 per cent and for non-disabled students it was 87.2 per cent. The benchmark is 86.9 per cent.
For theme 2: Learning opportunities, the NSS 2025 positivity measure for disabled students was 82.2 per cent and for non-disabled students it was 85.0 per cent. The benchmark is 84.0 per cent.
For theme 3: Assessment and feedback, the NSS 2025 positivity measure for disabled students was 78.2 per cent and for non-disabled students it was 81.9 per cent. The benchmark is 80.8 per cent.
For theme 4: Academic support, the NSS 2025 positivity measure for disabled students was 85.2 per cent and for non-disabled students it was 88.3 per cent. The benchmark is 87.4 per cent.
For theme 5: Organisation and management, the NSS 2025 positivity measure for disabled students was 72.6 per cent and for non-disabled students it was 80.1 per cent. The benchmark is 76.5 per cent.
For theme 6: Learning resources, the NSS 2025 positivity measure for disabled students was 85.1 per cent and for non-disabled students it was 88.5 per cent. The benchmark is 87.4 per cent.
For theme 7: Student voice, the NSS 2025 positivity measure for disabled students was 73.4 per cent and for non-disabled students it was 78.6 per cent. The benchmark is 76.2 per cent.
In most cases these gaps have grown over the past two years.20 In 2023, disabled students overall gave a score 2.5 percentage points lower for the assessment and feedback theme than their non-disabled peers, whereas in 2025 the figure is 3.7 percentage points. The gap for organisation and management in 2023 was 6.5 percentage points, which has grown to 2025’s 7.5 percentage points. More detail is shown in Table 2.
Table 2: Positivity measures for disabled and non-disabled students by NSS theme, 2023 to 2025
| NSS theme | Teaching on my course | Learning opportunities | Assessment and feedback | Academic support | Organisation and management | Learning resources | Student voice |
|---|---|---|---|---|---|---|---|
| 2023 disability reported (%) | 83.9 | 79.3 | 76 | 80.8 | 68.5 | 83.3 | 68 |
| 2023 no disability reported (%) | 84.9 | 81.9 | 78.5 | 84 | 75 | 86.8 | 72.9 |
| 2023 difference (percentage points) | -1 | -2.6 | -2.5 | -3.2 | -6.5 | -3.5 | -4.9 |
| 2024 disability reported (%) | 84.2 | 80.3 | 75.8 | 82.9 | 69.7 | 84 | 69.9 |
| 2024 no disability reported (%) | 85.6 | 83 | 79.2 | 86.1 | 76.8 | 87.5 | 75.1 |
| 2024 difference (percentage points) | -1.4 | -2.7 | -3.4 | -3.2 | -7.1 | -3.5 | -5.2 |
| 2025 disability reported (%) | 85.5 | 82.2 | 78.2 | 85.2 | 72.6 | 85.1 | 73.4 |
| 2025 no disability reported (%) | 87.2 | 85 | 81.9 | 88.3 | 80.1 | 88.5 | 78.6 |
| 2025 difference (percentage points) | -1.7 | -2.8 | -3.7 | -3.1 | -7.5 | -3.4 | -5.2 |
The NSS categories allow us to separate out the results for students with specific types of disability (mental health conditions; sensory, medical, or physical impairments; social or communication impairments; cognitive or learning difficulties; and multiple or other impairments). This data is available on our NSS data dashboard and there is further discussion in a blog post on our website, titled ‘Is higher education doing enough to support disabled students?’.21
In some instances, these groups may be relatively small, so we need to be cautious in the conclusions we draw. This data does, however, give us some insight into the experiences of the students responding to the survey. For example, for Theme 7: Student voice, the positivity measure for students with multiple or other impairments falls furthest below the benchmark for disabled students (-4.2 percentage points). Students with a social or communication impairment score closest to this benchmark (-0.3 percentage points). The variations in responses from students with different types of disability reminds us that disabled students have individual needs and are not a homogenous group.
Student insight
Alongside this Insight brief we are publishing a report we commissioned from the polling company Savanta, exploring how disabled students experience the process of applying for, accessing and benefitting from learning support plans and reasonable adjustments.22
Key findings of the student insight summary report
- 73 per cent said that they were well informed about the requirements for applying for learning support and reasonable adjustments. 70 per cent found the process easy to navigate, while 17 per cent experienced issues with the process.
- Interview participants noted some areas for improvement in the application process. This included providing more personalised and detailed information, particularly about available support for specific health conditions, rather than a ‘one-size-fits-all’ approach. Some also mentioned the need for clearer details about the application process, including waiting times and deadlines.
- 43 per cent of applications were either fully or partially rejected. Of the respondents who experienced this, 78 per cent were not given an explanation, and 91 per cent took further action such as seeking advice or appeal.
- 86 per cent of those whose support was implemented found it met or exceeded their expectations. Very similar percentages found that their academic performance improved as a result, and that they understood their course material better.
- However, others described negative experiences, often involving support that lacked personalisation, delays and poor communication (particularly with external providers), or complex processes that did not effectively address their specific needs.
- Awareness of inclusive practice appeared to be limited among students.
The summary report authors warn that the research must be interpreted with caution, given the small survey sample size of only 150 students, and the diversity of disabled students’ experience. Some of the findings are unexpected, in that they are more positive than those of, for instance, Disabled Students UK’s 2024 Access Insights Report.23 For example, 73 per cent said that they were well informed about the requirements for applying for learning support and reasonable adjustments, and 86 per cent of those whose support was implemented found it met or exceeded their expectations.
Nevertheless, the report does find that a minority of those students who gained support were dissatisfied with the adjustments that were made, saying that the support was of a general nature rather than meeting their specific needs, or was affected by delays and communication issues, particularly when provided by external contractors. It shows that a significant proportion of disabled students who did not have all of their application accepted went on to make an internal complaint or a complaint to the OIA. The report also suggests that universities need to better define and promote the full range of their inclusion initiatives, such as staff training and awareness campaigns.
Reasonable adjustments in higher education
Information about legal requirements and good practice regarding reasonable adjustments for disabled students is available from the Equality and Human Rights Commission, which enforces the Equality Act 2010:
- Advice note for the higher education sector from the legal case of University of Bristol vs Abrahart.
- Technical guidance on further and higher education, Chapter 7.
Additional information is available from:
- Advance HE: Disabled Student Commitment: Competence standards and reasonable adjustments.
- Office of the Independent Adjudicator for Higher Education: What does the law say?
What are universities and colleges saying?
In March 2025, with the support of higher education sector bodies and representative groups, we held workshops to gather the perspectives of university and college representatives about the provision of reasonable adjustments required by law for disabled students. Across all workshops we collected views from 105 attendees, not all necessarily representing separate institutions. The aims of these workshops were to:
- hear directly from universities and colleges about their experiences and perspectives
- identify the policies and processes currently in place and how they function
- discuss what works well and where improvements could be made to better support disabled students.
We held workshops with members of the Association of Managers of Student Services in Higher Education, Guild HE, Independent HE, the National Association of Disability Practitioners and the Association of Colleges.
In response to a multiple choice question (in which multiple options could be selected), participants described how far they use informal and formal processes to understand whether individual reasonable adjustments are effective and whether approaches are effective across the university or college. 60.0 per cent of the 105 respondents indicated that there is an informal process for evaluating the effectiveness of reasonable adjustments at their university or college, but only 16 of them (15.2 per cent) had an established process for systematically evaluating their effectiveness. Figure 5 illustrates their responses.
Figure 5: Responses to ‘Does your provider assess whether reasonable adjustments are suitable and effective for students, both on an individual basis and systematically?’
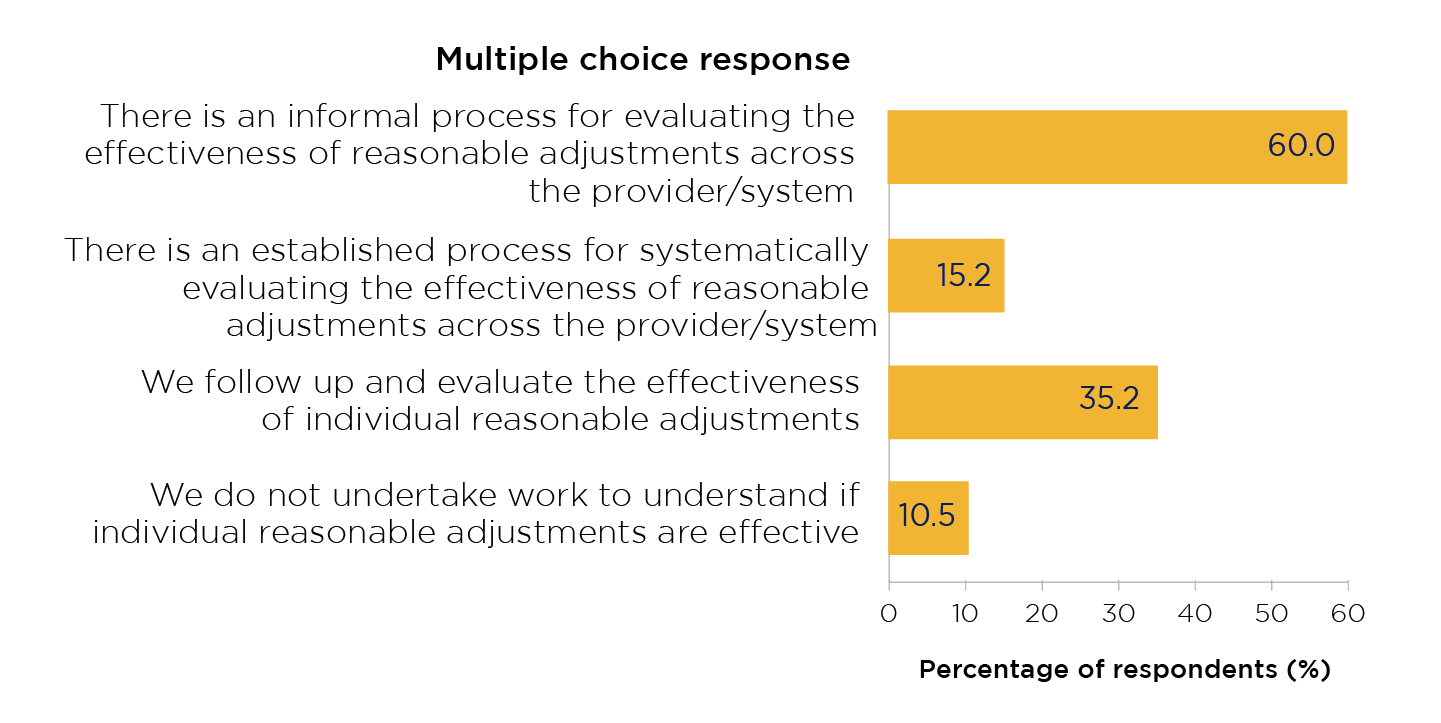
Note: 105 respondents in total. Multiple options could be selected, so the percentages given in this chart will not add up to 100 per cent. ‘Provider/system’ refers to the system for reasonable adjustments across a higher education provider (for example a university or college).
This bar chart shows the percentage of respondents responding to options in the question ‘Does your provider assess whether reasonable adjustments are suitable and effective for students, both on an individual basis and systematically?’ The Y axis shows the question options and the X axis shows the percentage of respondents.
There were 60.0 per cent of respondents responded to the option: ‘There is an informal process for evaluating the effectiveness of reasonable adjustments across the provider/system’.
There were 15.2 per cent of respondents responded to the option: ‘There is an established process for systematically evaluating the effectiveness of reasonable adjustments across the provider/system’.
There were 35.2 per cent of respondents responded to the option: ‘We follow up and evaluate the effectiveness of individual reasonable adjustments’.
There were 10.5 per cent of respondents responded to the option: ‘We do not undertake work to understand if individual reasonable adjustments are effective’.
We asked workshop participants about challenges in the application and implementation process for reasonable adjustments, about what works well in the process of student applications for adjustments and their implementation, and about practices that are inclusive of disabled students in course and assessment design, including inclusive practice frameworks.24 Their comments are reported here, under the following seven overarching themes.
Whole-institution approach to disability
Participants spoke about a whole-institution approach to disability, in which the support and inclusion of disabled students is seen as the responsibility of everyone working at a university or college, not just its specialist disability support staff. Participants suggested that it can be challenging to implement such an approach consistently, especially in devolved university and college structures. They talked about the importance of accountability being set at a senior level, with leaders fully engaged in inclusive practices and aware of the impact and importance of reasonable adjustments. They also spoke about the need for robust training on how to support disabled students, and the importance of adequate systems to collect and share student information and to record and share reasonable adjustments.
Finance and resources
Participants noted that more students are reporting a disability, and a growing number are presenting with complex support needs. These require resources and funding to support, including the skills and available workload of teaching and assessment staff. They talked about how this can be challenging in a difficult financial context for much of the sector and can manifest as staff shortages, staff time being stretched over multiple roles, and challenges in recruiting and retaining staff in disability services. The layout or structure of buildings, and a lack of technical resources to enable hybrid or remote access to studies, were also mentioned as barriers to implementing effective adjustments.
Participants told us that academic staff need to remember and implement a variety of support plans on top of often already challenging workloads. Some academic staff have not been trained, or have no experience, in delivering alternative teaching and assessment methods. Participants said that a lack of clear supporting resources sometimes means that staff feel unequipped to employ inclusive practices, skills differ among teams, and thus teaching and assessment practice may not be consistent. They also noted that academic staff often have large workloads and therefore little capacity to design and implement significant changes to teaching and assessment, even when introducing those designs might reduce subsequent workload by reducing the need for adjustments.
Clear communication
Participants noted that clear communication is especially important during the transition to university or college. They identified challenges in managing students’ and their parents’ expectations of what a university or college can and should provide, and said that the transition point into and out of higher education can be difficult for disabled students to navigate. They talked about ways of clearly communicating about support for disabled students. One approach described is to make disability and support services clearly visible at open days, and during enrolment and induction. Disabled students can be encouraged to visit the institution before the start of their course, for example through summer schools. Pre-arrival questionnaires can help facilitate the disclosure of disabilities, and lead to the university or college being more prepared for providing support. Participants saw a personalised approach as important, including open discussions with disabled students about barriers to learning, and giving each one a named point of contact for reasonable adjustments.
Effective information-sharing and training within universities and colleges were also identified as important. This includes training academic staff training on inclusion and reasonable adjustments, and close contact between academic and disability support staff. It might include implementing partnership arrangements between these staff groups, or embedding disability advisers in academic teams. Early intervention approaches were found to be effective; for example, making contact with a disabled student who is attending teaching never or infrequently, to explore any adjustments that could be put in place. Participants also identified effective case management systems as helping with internal information-sharing, including with academic staff, about supporting disabled students.
Culture, understanding and engagement
Participants noted that students may delay requesting adjustments, some only doing so very close to their assessment periods. Difficulties for disability support services can also arise when students do not respond to communications about adjustments. Some students may not engage with the concept or terminology of inclusive practice, or may have negative perceptions of it. Participants talked of the importance of clear communication with students about inclusive practice, including reviewing terminology and how it might be made more accessible. They said that some disabled students perceive inclusive practice as the university or college avoiding making adjustments to meet their individual needs, and therefore worry that they will no longer get the support they are entitled to.
Participants pointed out that it can be challenging to ensure that all relevant teaching staff read and implement support plans, and that implementation within departments and across faculties can be inconsistent. They talked about how better training and guidance would support academic staff to positively engage with support plans. They also noted that some staff can be sceptical about the efficacy of inclusive practices, and have concerns about whether alternative teaching and assessment methods present an appropriate level of academic rigour and challenge. Participants discussed how clear guidance on inclusive practice can enable teaching staff to implement approaches confidently and effectively.
Assessment methods
Participants discussed how concerns that new technologies that employ artificial intelligence may facilitate academic misconduct have led some courses to revert to a narrower, more traditional range of assessment methods (such as exams and other timed or unseen assessments, rather than coursework or 24-hour assessments). They noted that this can negatively impact disabled students if not handled carefully.
Relations with other bodies
Participants identified some wider challenges with other systems or processes. These included lacking control over the implementation of adjustments while students are on placements, and the perceived requirements of professional, statutory and regulatory bodies or degree awarding partners sometimes presenting barriers to the implementation of adjustments. Universities and colleges may have little or no opportunity to adapt the assessment requirements of partnership and accreditation bodies, or have no supported way of engaging in a conversation with such a body about changes. They also highlighted that NHS and other diagnostic services that can support and inform students are often overstretched, with long waiting times.
Evidence requirements
Participants noted that it can be useful to review the evidence required for reasonable adjustments to be implemented. They spoke about how a tiered system may be useful, to allow a standard range of adjustments requiring no evidence. They also spoke about how medical evidence could be requested only where implementing adjustments would involve a significant cost, or where it is essential to understanding what adjustments might be effective. Institutional funding for diagnostic assessments, or in-house screening, was raised as possibly being helpful.
What is the OfS doing?
The OfS supports and challenges universities and colleges to improve equality of opportunity for disabled students through the Equality of Opportunity Risk Register and access and participation plans. Access and participation plans set out how universities and colleges will improve equality of opportunity for disadvantaged groups to access, succeed in and progress from higher education. Every institution registered with the OfS that charges above the basic tuition fee cap must have an access and participation plan approved by the OfS.
The Equality of Opportunity Risk Register identifies 12 sector-wide risks that may affect a student’s opportunity to access and succeed in higher education.25 It also identifies the student characteristics that are most likely to indicate risks to equality of opportunity, which include being disabled.26 We expect universities and colleges to use the register to identify any of their prospective or current students likely to be affected by the risks, and which groups may be most at risk, and then to consider how best to reduce these risks in their access and participation plans.
We also distribute funding on behalf of the government to registered universities and colleges in England, including the disabled student premium. This is funding to support access and success for disabled students. In the 2025-26 the OfS distributed more than £43 million for the disabled students’ premium.27
We run funding competitions that allow universities and colleges to bid for funding to address priority issues that affect students. For example, in September 2024 we launched a call for bids for the Equality in Higher Education Innovation Fund. This fund is now supporting universities and colleges and a range of partners to promote equality of opportunity, including for disabled students.28
We publish the latest available data about student characteristics, including for students who report a disability, and we work with the Disability in Higher Education Advisory Panel, listening to its members’ expert advice on how to improve disabled students’ experiences of higher education.
Work being done to improve the experiences of disabled students
The Disabled Student Commitment was developed and consulted on by the Disabled Students’ Commission, to advise, inform and influence universities and colleges. 25 institutions have already signed up to adopt and promote a commitment to secure an enhanced and improved experience for disabled students.29
The National Association of Disability Practitioners, the professional association for those involved in the management or delivery of services for disabled higher education students, provides resources, codes of practice and peer support for its members.30
Our Equality in Higher Education Innovation Fund is supporting 52 universities, colleges and third sector organisations in 11 collaborative projects. These deliver new and innovative ideas to promote equality of opportunity, including for disabled students, and will run until July 2027.31
We have run three funding programmes for mental health among students, to help universities and colleges develop practical and innovative interventions and share outputs and evaluation of their projects with the higher education sector.32
The University Mental Health Charter, devised by Student Minds, calls on institutions to adopt a whole-university approach to mental health, and to promote the mental health and wellbeing of all members of their community.33
The Association of Colleges operates its own Mental Health Charter, to improve mental health and wellbeing support in colleges on the basis that mental health is a priority for all.34
TASO (Transforming Access and Outcomes in Higher Education) provides an evidence toolkit for student mental health.35
Conclusion
The experiences of disabled students in higher education are persistently reported as poorer than those of their non-disabled peers. This Insight brief draws on multiple sources to show how there is important work to be done to improve the experiences of disabled students in English higher education. As well as being highlighted by the Disability in Higher Education Advisory Panel, the need for better support for disabled students is visible in the results of the Disabled Students UK survey and the NSS, and the complaints dealt with by the OIA.
The positive work being undertaken by universities and colleges in this area is important to celebrate. In particular, adoption of the Disabled Student Commitment led by Advance HE indicates a positive commitment from many institutions to engage with more fully meeting the support needs of disabled students. Nevertheless, more work is necessary in this area.
Even in challenging times, when many institutions are facing financial pressures, the need to comply with equality legislation in support for disabled students continues to apply. Universities and colleges should devote adequate resources to meeting these students’ needs.
We invite universities and colleges to reflect on the points for consideration listed in this brief. Protecting funding for support from cost-cutting is important, but so is a whole-institution approach to disability, and establishing accountability so that students know who is responsible for ensuring that they can access higher education on an equal footing with their non-disabled peers. Clear communication with students is also essential, including gathering their views and discussing them in decision-making contexts. Training for staff, and clear processes for students to apply for and give feedback on reasonable adjustments and other support, are important for ensuring students have an equitable experience.
Notes
- In this brief, for the sake of readability, we have used ‘universities and colleges’ (or sometimes simply ‘universities’ or ‘institutions’) to refer to what our regulatory framework and other more formal documents call ‘higher education providers’ or ‘providers’.
- See Advance HE, Disabled Students' Commission and OfS, Disability in Higher Education Advisory Panel. The Disability in Higher Education Advisory Panel succeeded the Disabled Students’ Commission, which we created and funded between 2020 and 2023.
- See Equality Act 2010 - Section 6; Equality Act 2010 – Schedule 1, Part 1; and Definition of disability under the Equality Act 2010. A person is automatically defined as disabled under the Act if they have been diagnosed with HIV, cancer or multiple sclerosis.
- See Equality Act 2010 – Schedule 13; and Technical guidance on further and higher education (Chapter 7: Disabled persons: reasonable adjustments).
- See Universal Design for Learning.
- From OfS, Student characteristics data: Population data dashboard. This is the latest data available at the time of writing.
- See OfS, Student characteristics data.
- See HESA, Data dictionary: Disability.
- See OfS, Student characteristics data: Population data dashboard. This is the latest data available at the time of writing.
- See OfS, Student characteristics data: Outcomes data dashboard. This is the latest data available at the time of writing. Rates are for taught or registered students.
- See OfS, Student characteristics data: Outcomes data dashboard. This is the latest data available at the time of writing. Rates are for taught or registered students.
- See OfS, Student characteristics data: Outcomes data dashboard. This is the latest data available at the time of writing. Rates are for taught or registered students.
- See Disabled Students UK, ‘The 2024 Access Insights Report’, 2024, page 68. The report states that students from over 80 institutions participated in the survey.
- In total 3,613 complaints from disabled students were received in 2024, 3,137 in 2023. OIA, ‘Annual report 2023’ pages 18 to 24 and ‘Annual report 2024’ page 7, available at OIA, ‘Annual reports’.
- For more information about the methods used for the NSS and the questions in NSS 2025, see OfS, National Student Survey and The National Student Survey 2025. The NSS is managed by the OfS on behalf of the UK funding and regulatory bodies – the OfS, the Department for the Economy (Northern Ireland), Medr (the Commission for Tertiary Education and Research in Wales) and the Scottish Funding Council. However, all NSS data cited in this Insight brief is for England only.
- For each theme in the NSS (and for each question within a theme), the positivity measure is the proportion of respondents who gave a positive answer. Students and their responses are categorised according to multiple demographic characteristics. As these themes are multifaceted, multiple questions are asked to measure each concept. Currently the NSS asks 28 questions covering aspects of the student academic experience. Students respond to each question by choosing from five points on the scale – two positive, two negative, and a ‘not applicable’ option.
- For more information about benchmarks, see ‘What are benchmarks, and how should I use them?’ at OfS, About the NSS data.
- Figures are taken from OfS, ‘National Student Survey 2025 data: Student characteristics data’.
- See OfS, ‘National Student Survey 2025 data: Student characteristics data’.
- The exceptions are in learning resources and academic support, where they have decreased very marginally.
- See OfS, ‘National Student Survey 2025 data: Student characteristics data’. Under ‘Select a characteristic’, select ‘disability type’. See OfS, ‘Is higher education doing enough to support disabled students?’ (blog, July 2025).
- See Savanta, ‘Student voice tracking study: Experiences of disabled students in accessing learning support options’, hosted at OfS, ‘One size doesn’t fit all: Equality of opportunity for disabled students’. The report was based on nine in-depth qualitative interviews followed by a quantitative survey of 150 disabled students, taking place between December 2024 and January 2025. Respondents could report single or multiple impairments: 57 per cent said they had a mental health condition, 59 per cent a sensory, medical or physical impairment, 30 per cent a social or communication impairment, 23 per cent cognitive or learning difficulties, and 3 per cent other impairments or conditions.
- See Disabled Students UK, ‘The 2024 Access Insights Report’, 2024.
- For an overview of inclusive practices in higher education, see Advance HE, Inclusive learning and teaching.
- See OfS, Equality of Opportunity Risk Register.
- See OfS, Student characteristics.
- For more information about recurrent funding distributed by the OfS, see OfS, Recurrent funding and OfS, Funding for 2025-26: Decisions and allocations.
- See OfS, Equality in Higher Education Innovation Fund.
- See Advance HE, ‘Disabled Students’ Commission’.
- See NADP, ‘Resources’.
- See OfS, ‘Equality in Higher Education Innovation Fund’.
- See OfS, ‘Funding for student mental health’. While some of these projects focus specifically on students with a mental health condition as a disability, or the intersection between neurodivergence and mental health, other projects may be addressed towards a broader definition of mental health.
- See Student Minds Hub, ‘University Mental Health Charter’.
- Association of Colleges, ‘Mental Health Charter’.
- See TASO, ‘Evidence toolkit: Student mental health’.
Describe your experience of using this website