The National Student Survey: Student experience during the pandemic
The National Student Survey gauges students’ experiences of learning and teaching at university or college. This year it enables us to look at the impact of the covid pandemic on their experiences, including the special arrangements universities and colleges have put in place for learning, teaching and wellbeing support. The information provided will be useful to universities, colleges, prospective students and the Office for Students when making future decisions.
- Date:
- 15 July 2021
Read the brief
Download the Insight brief as a PDF
Get the data
Download the Insight brief data
The Office for Students is the independent regulator of higher education in England. We aim to ensure that every student, whatever their background, has a fulfilling experience of higher education that enriches their lives and careers. We regulate to promote quality, choice, competition and value for money in higher education, with a particular remit to ensure access, success and progression for underrepresented and disadvantaged groups of students. The NSS is funded by the Office for Students, the Scottish Funding Council, the Higher Education Funding Council for Wales, the Department for Economy Northern Ireland, and Health Education England.
Introduction
The National Student Survey (NSS) is the largest and longest-running annual survey of UK students. The results this year are of especial interest due to the covid pandemic, and the disruption it and the multiple lockdowns caused to students and their studies.1
The NSS has long been an important indicator of students’ opinions and experiences. It can indicate to universities and colleges what is working and what is not.2 It is used widely – by academics, library staff, students’ unions and professional services – to enhance the student experience.3 Prospective students can use it as a source of information to guide their choice of university or college.4
During the pandemic, the survey also indicates how multiple lockdowns, changes to face-to-face teaching, and social distancing have impacted the student experience. The survey can offer a guide to universities and colleges about which aspects of remote and blended teaching are working and which are not. It can show how well students felt their university or college supported their mental wellbeing. It can show us whether certain groups of students fared better or worse than others.
For the Office for Students (OfS), the NSS is an important regulatory tool. It gives us access to student voices. It lets us measure aspects of the quality of courses and higher education providers. We publish and analyse the data as, given the public investment in higher education, such official information should be transparent and in the public domain.
Background
The National Student Survey is an annual census of all final year undergraduate students at UK universities. It has been conducted since 2005 and attracts a response rate of around 70 per cent each year. The survey is conducted between January and April each year.
The survey uses a Likert scale designed to measure collective student responses to a concept – for example, the concept of ‘learning community’. As concepts are multifaceted, multiple questions are asked to measure each concept. Students respond to each question by choosing from five points on the scale, ranging from ‘Definitely agree’ to ‘Definitely disagree’, or by choosing ‘Not applicable’.
The NSS currently asks 27 questions covering various aspects of the student academic experience. It also has the potential to ask additional topical questions. As a previous Insight brief argued, the NSS has seen exceptional consistency over the last 15 years.5
The 2020 NSS – which ran from 6 January to 30 April 2020 – took place partially during the pandemic declared by the World Health Organisation on 11 March 2020. On 16 March, the UK government advised against non-essential contact with others, and suggested that people should work from home if possible. The first national lockdown began on 23 March.
The impact of the pandemic on the 2020 NSS was not marked, mainly because the majority of respondents answered the survey before the full effect of the pandemic was felt. The OfS did not find evidence that the reliability of the statistics had been impaired by the pandemic. Nor was there evidence that the results had been strongly affected.6
The 2021 NSS ran between 6 January to 30 April 2021, with the UK once again in national lockdown. From 6 January, the government told universities and colleges that teaching should remain online only for nearly all students until at least mid-February. This requirement was not lifted until 17 May. Social distancing measures – including limits on the ability to socialise with people from different households, and a ban on non-essential travel – remained in place.
In 2021, the core questions did not change. However, we included six topical questions on the pandemic and its impact on students’ experience. These additional questions are only asked online after the main survey has been completed. This means that the response rate is lower than for the main survey.
To reduce the burden on universities and colleges during the pandemic, providers in England were not required to promote the 2021 survey to their students. If, by mid-March, their response rates were below a certain threshold, they were automatically included in a booster phase to send additional reminders to their non-responding students.7
Data quality
Despite the pandemic, subsequent lockdowns, and these changes to the promotion of the survey, response rates for the core questions remained high at 69.3 per cent. We received 332,500 responses.8
The data remains of high quality. We could not identify changes in response trends that could be attributed to events during the survey window, such as the gradual easing of lockdown. While response rates vary between different student groups, this variation is no higher than in previous years.
We received 184,964 responses to the covid-related questions, giving us a response rate of 38.6 per cent. The lower response rate is mainly because the questions were only asked online. Since there are large variations in the response rates for different providers, we have only published higher-level statistics.
Key findings
Core questions
The agreement rate for all scales has fallen since 2020, disrupting a previously stable time series. The decline is particularly marked for the ‘Learning resource’ scale, which has fallen by 12.2 percentage points, from 85.8 per cent to 73.6 per cent. The ‘Learning community’ scale has also fallen sharply, from 75.7 per cent to 66.5 per cent. The agreement rate for the final summary question fell from 82.6 per cent to 75.4 per cent.
Figure 1: Changes in agreement rate over time
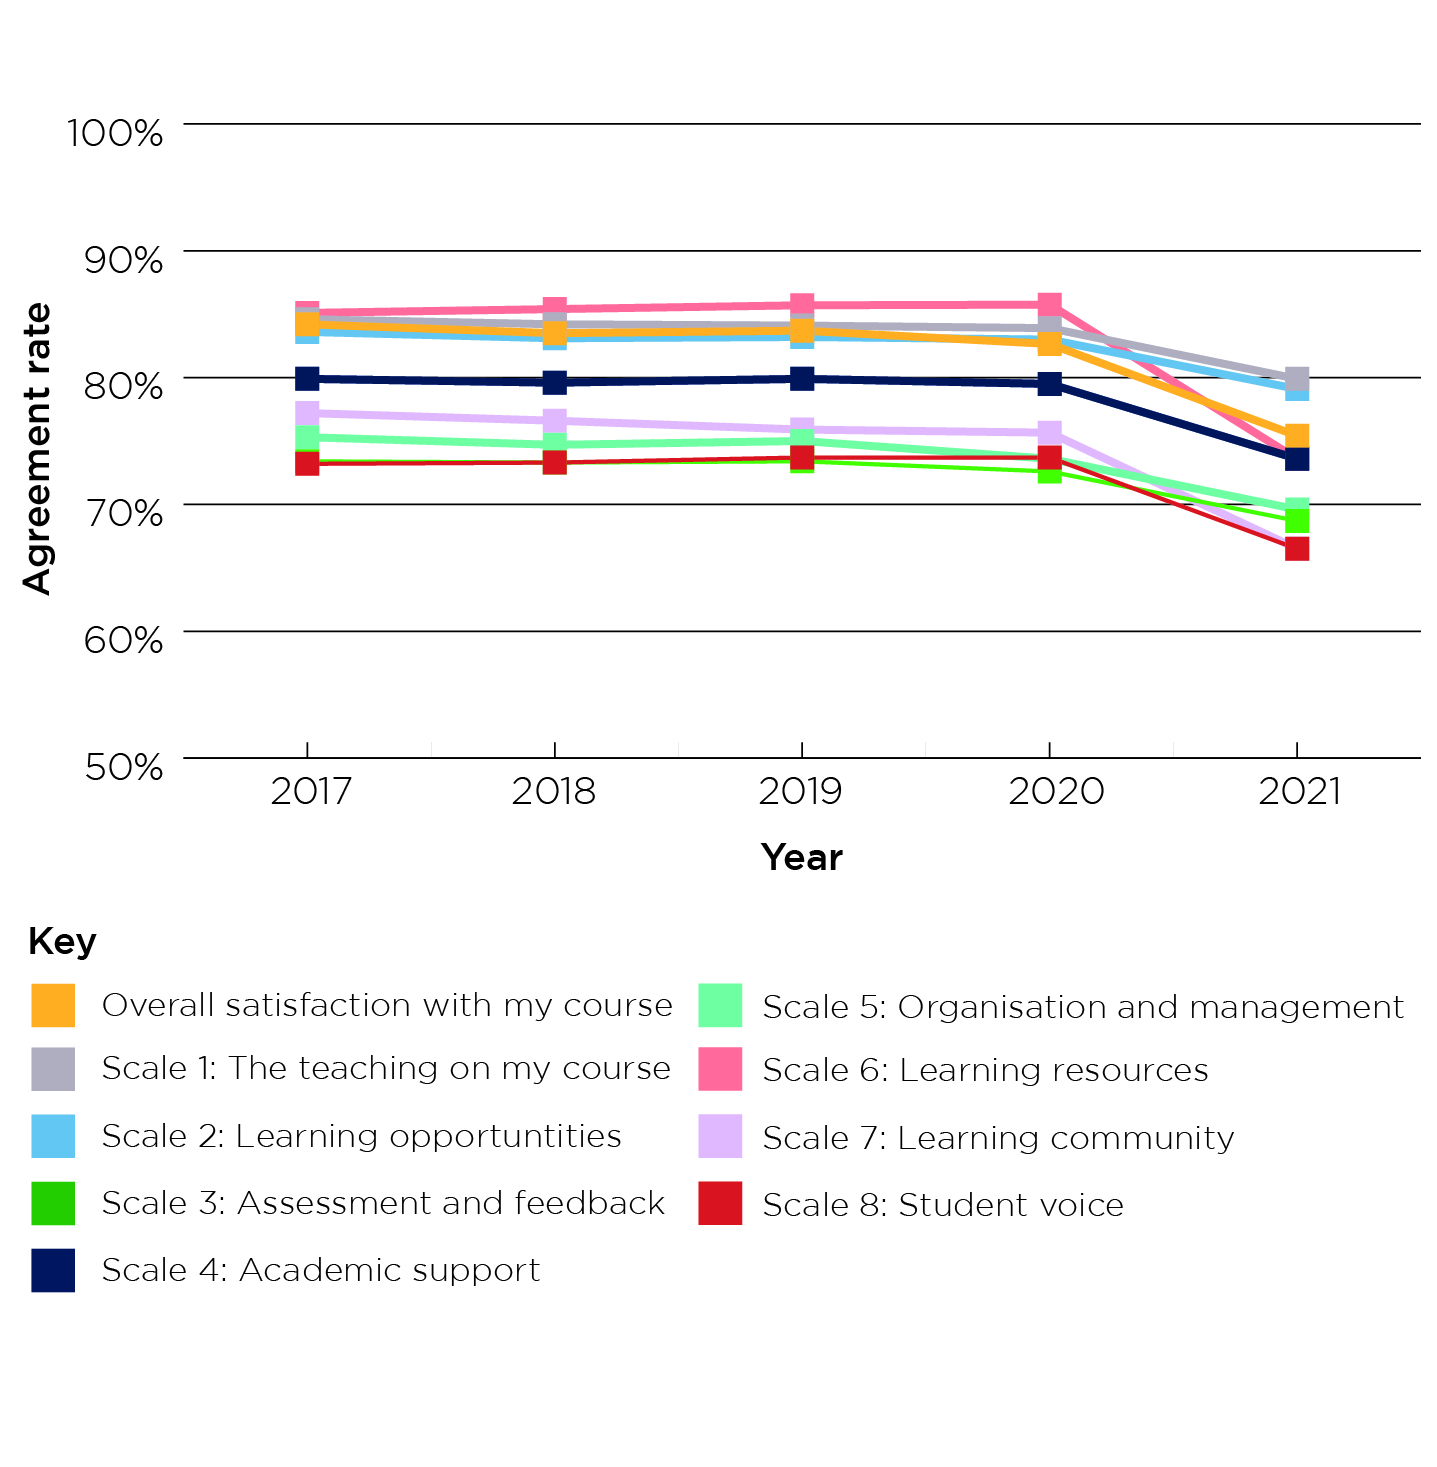
Figure 1 is a line chart with nine lines. It shows changes in agreement rate by different scales over time. It shows that, while agreement levels for all scales have remained largely stable between 2017 and 2020, they all fell in 2021.
It shows:
- For overall satisfaction with my course, there was an agreement rate of 84.2 per cent in 2017, 83.5 per cent in 2018, 83.7 per cent in 2019, 82.6 per cent in 2020, and 75.4 per cent in 2021.
- For Scale 1, ‘The teaching on my course’, there was an agreement rate of 84.6 per cent in 2017, 84.2 per cent in 2018, 84.1 per cent in 2019, 83.9 per cent in 2020, and 79.9 per cent in 2021.
- For Scale 2, ‘Learning opportunities’, there was an agreement rate of 83.6 per cent in 2017, 83.1 per cent in 2018, 83.2 per cent in 2019, 83.0 per cent in 2020, and 79.1 per cent in 2021.
- For Scale 3, ‘Assessment and feedback’, there was an agreement rate of 73.4 per cent in 2017, 73.3 per cent in 2018, 73.4 per cent in 2019, 72.6 per cent in 2020, and 68.7 per cent in 2021.
- For Scale 4, ‘Academic support’, there was an agreement rate of 79.9 per cent in 2017, 79.6 per cent in 2018, 79.9 per cent in 2019, 79.5 per cent in 2020, and 73.6 per cent in 2021.
- For Scale 5, ‘Organisation and management’, there was an agreement rate of 75.3 per cent in 2017, 74.7 per cent in 2018, 75.0 per cent in 2019, 73.6 per cent in 2020, and 69.6 per cent in 2021.
- For Scale 6, ‘Learning resource’, there was an agreement rate of 85.1 per cent in 2017, 85.4 per cent in 2018, 85.7 per cent in 2019, 85.7 per cent in 2020, and 73.6 per cent in 2021.
- For Scale 7, ‘Learning community’, there was an agreement rate of 77.2 per cent in 2017, 76.6 per cent in 2018, 75.9 per cent in 2019, 76.0 per cent in 2020, and 66.7 per cent in 2021.
- For Scale 8, ‘Student voice’, there was an agreement rate of 73.2 per cent in 2017, 73.3 per cent in 2018, 73.7 per cent in 2019, 73.7 per cent in 2020, and 66.5 per cent in 2021.
Most universities and colleges have seen a fall in agreement rates, but there are exceptions. This is illustrated in Figure 2, which focuses on the most affected scale – learning resources – and is restricted to providers that received at least 100 responses to the 2021 NSS. Figure 2 shows that eight of these universities and colleges saw their agreement rates increase by one percentage point or more. For three, agreement rates remained broadly the same, and for the remaining 192 they fell by more than one percentage point. Even before the pandemic, provider-level agreement rates often changed from year to year, sometimes quite dramatically, so the changes shown in Figure 2 cannot be wholly attributed to exceptional circumstances.
Figure 2: Changes in agreement rates for Scale 6 (learning resources)
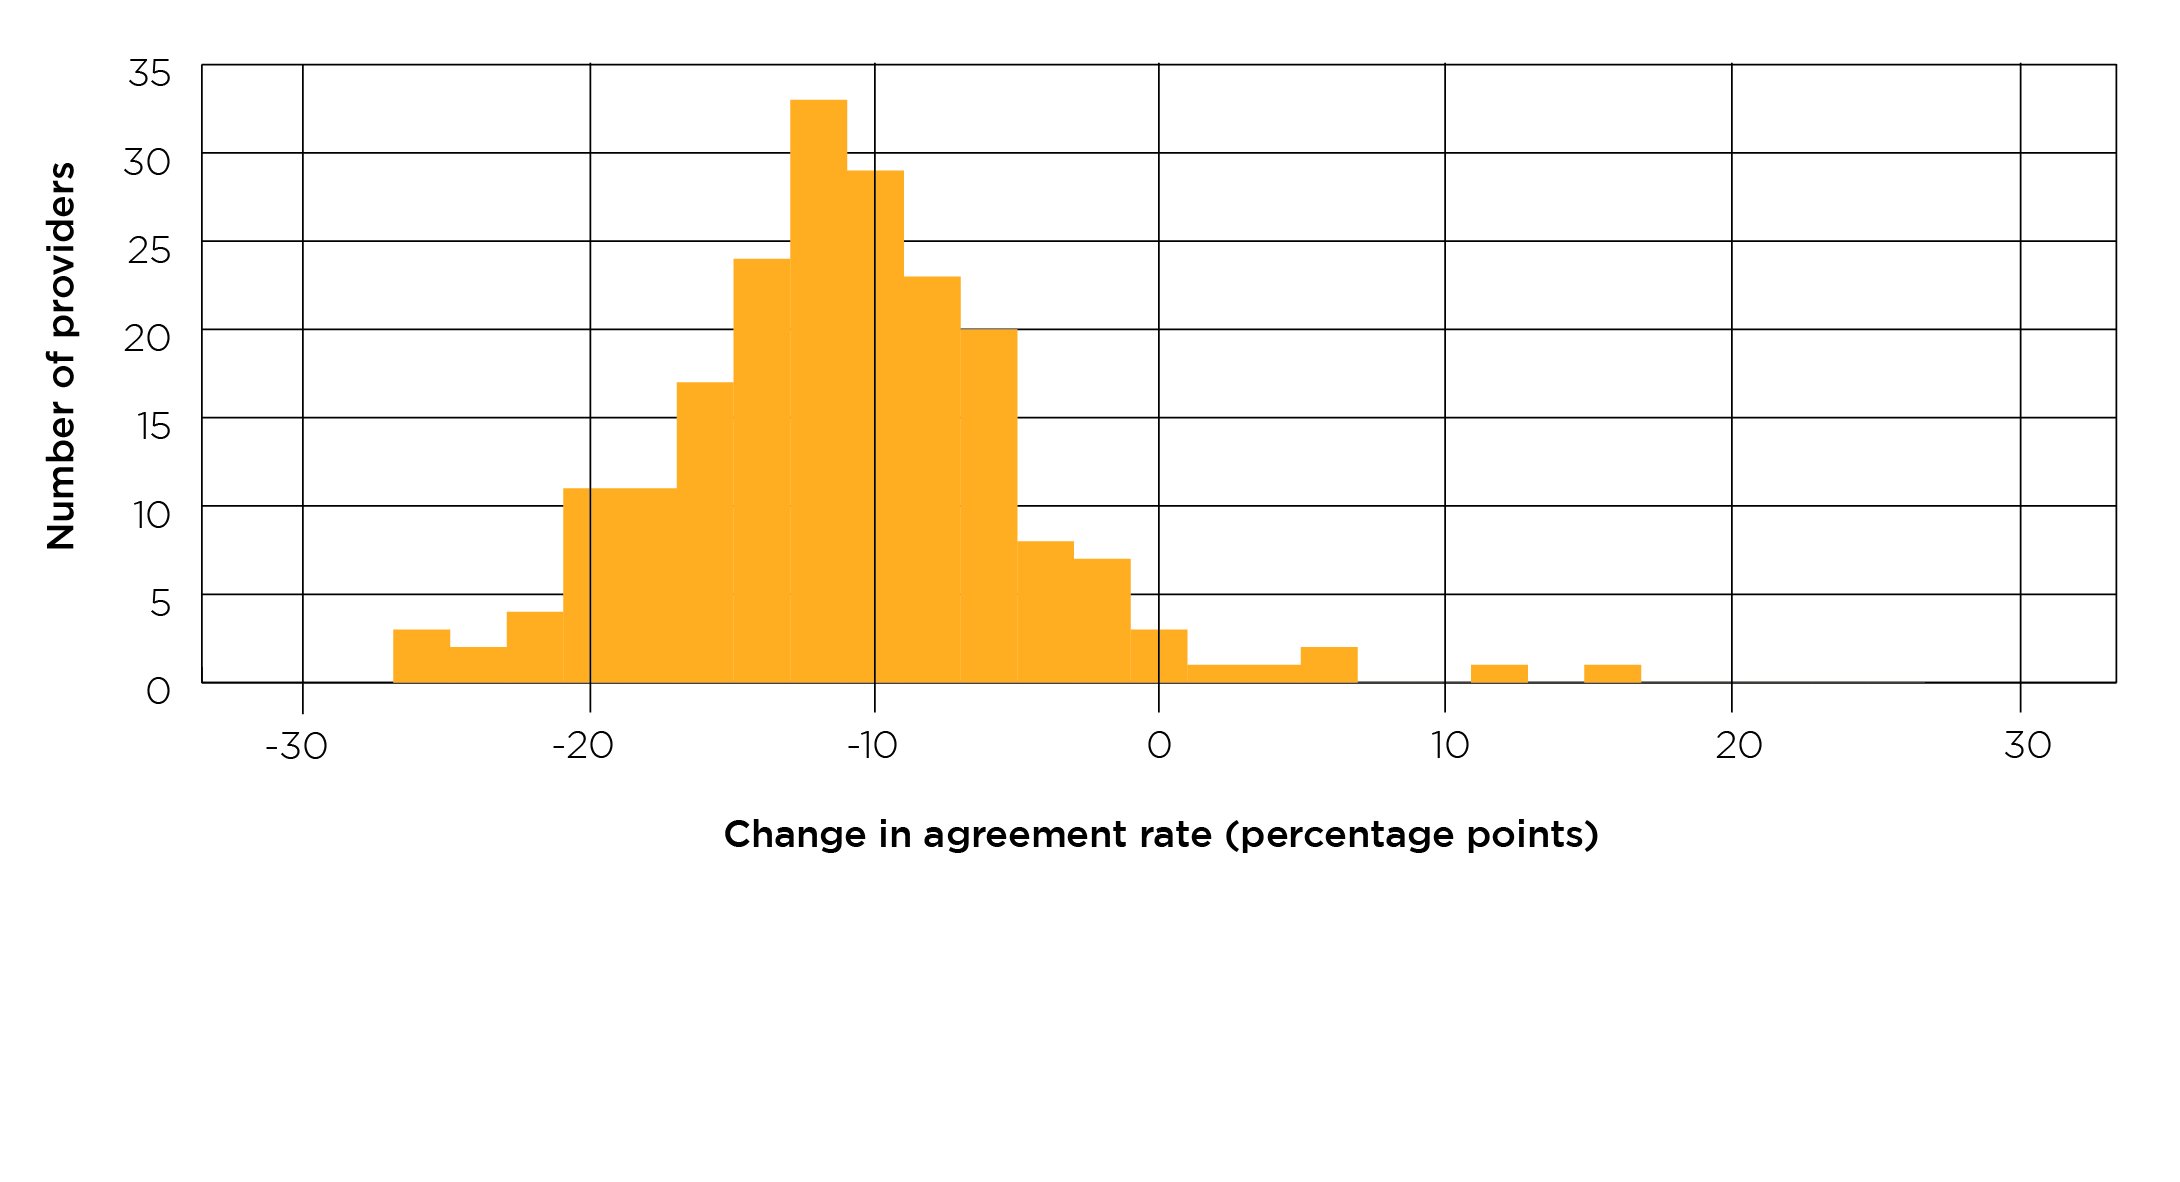
Note: Restricted to providers with at least 100 responses to the NSS.
Figure 2 is a bar chart showing the changes in agreement rate between 2020 and 2021 for Scale 6, ‘Learning resources’, by provider. It shows that nearly all providers have seen a fall in this scale over the last year.
It shows that:
- 3 providers saw a decline of between -27 and -25 percentage points.
- 2 providers saw a decline of between -25 and -23 percentage points.
- 4 providers saw a decline of between -23 and -21 percentage points.
- 11 providers saw a decline of between -21 and -19 percentage points.
- 11 providers saw a decline of between -19 and -17 percentage points.
- 17 providers saw a decline of between -17 and -15 percentage points.
- 24 providers saw a decline of between -15 and -13 percentage points.
- 33 providers saw a decline of between -13 and -11 percentage points.
- 29 providers saw a decline of between -11 and -9 percentage points.
- 23 providers saw a decline of between -9 and -7 percentage points.
- 20 providers saw a decline of between -7 and -5 percentage points.
- 8 providers saw a decline of between -5 and -3 percentage points.
- 7 providers saw a decline of between -3 and -1 percentage points.
- 3 providers saw a decline or increase of between -1 and 1 percentage points.
- 1 provider saw an increase of between 1 and 3 percentage points.
- 1 provider saw an increase of between 3 and 5 percentage points.
- 2 providers saw an increase of between 5 and 7 percentage points.
- 0 providers saw an increase of between 7 and 9 percentage points.
- 0 providers saw an increase of between 9 and 11 percentage points.
- 1 provider saw an increase of between 11 and 13 percentage points.
- 0 providers saw an increase of between 13 and 15 percentage points.
- 1 provider saw an increase of between 15 and 17 percentage points.
While the fall in agreement rates is present in most student groups, there are exceptions. Focusing on the overview provided by the summary question, the agreement rate for students who were already studying through distance learning has barely changed since 2020 (a 0.3 percentage point decrease, from 87.9 per cent to 87.6 per cent). Reflecting this, part-time students have seen less of a change than other respondents (1.6 percentage point decrease, 84.5 per cent to 82.9 per cent), as have students aged 25 or older (3.8 percentage points, 83.3 per cent to 79.6 per cent). Both part-time students and mature students are more likely to study through distance learning.
Figure 3: Changes in agreement rates over time for distance learners compared with other students
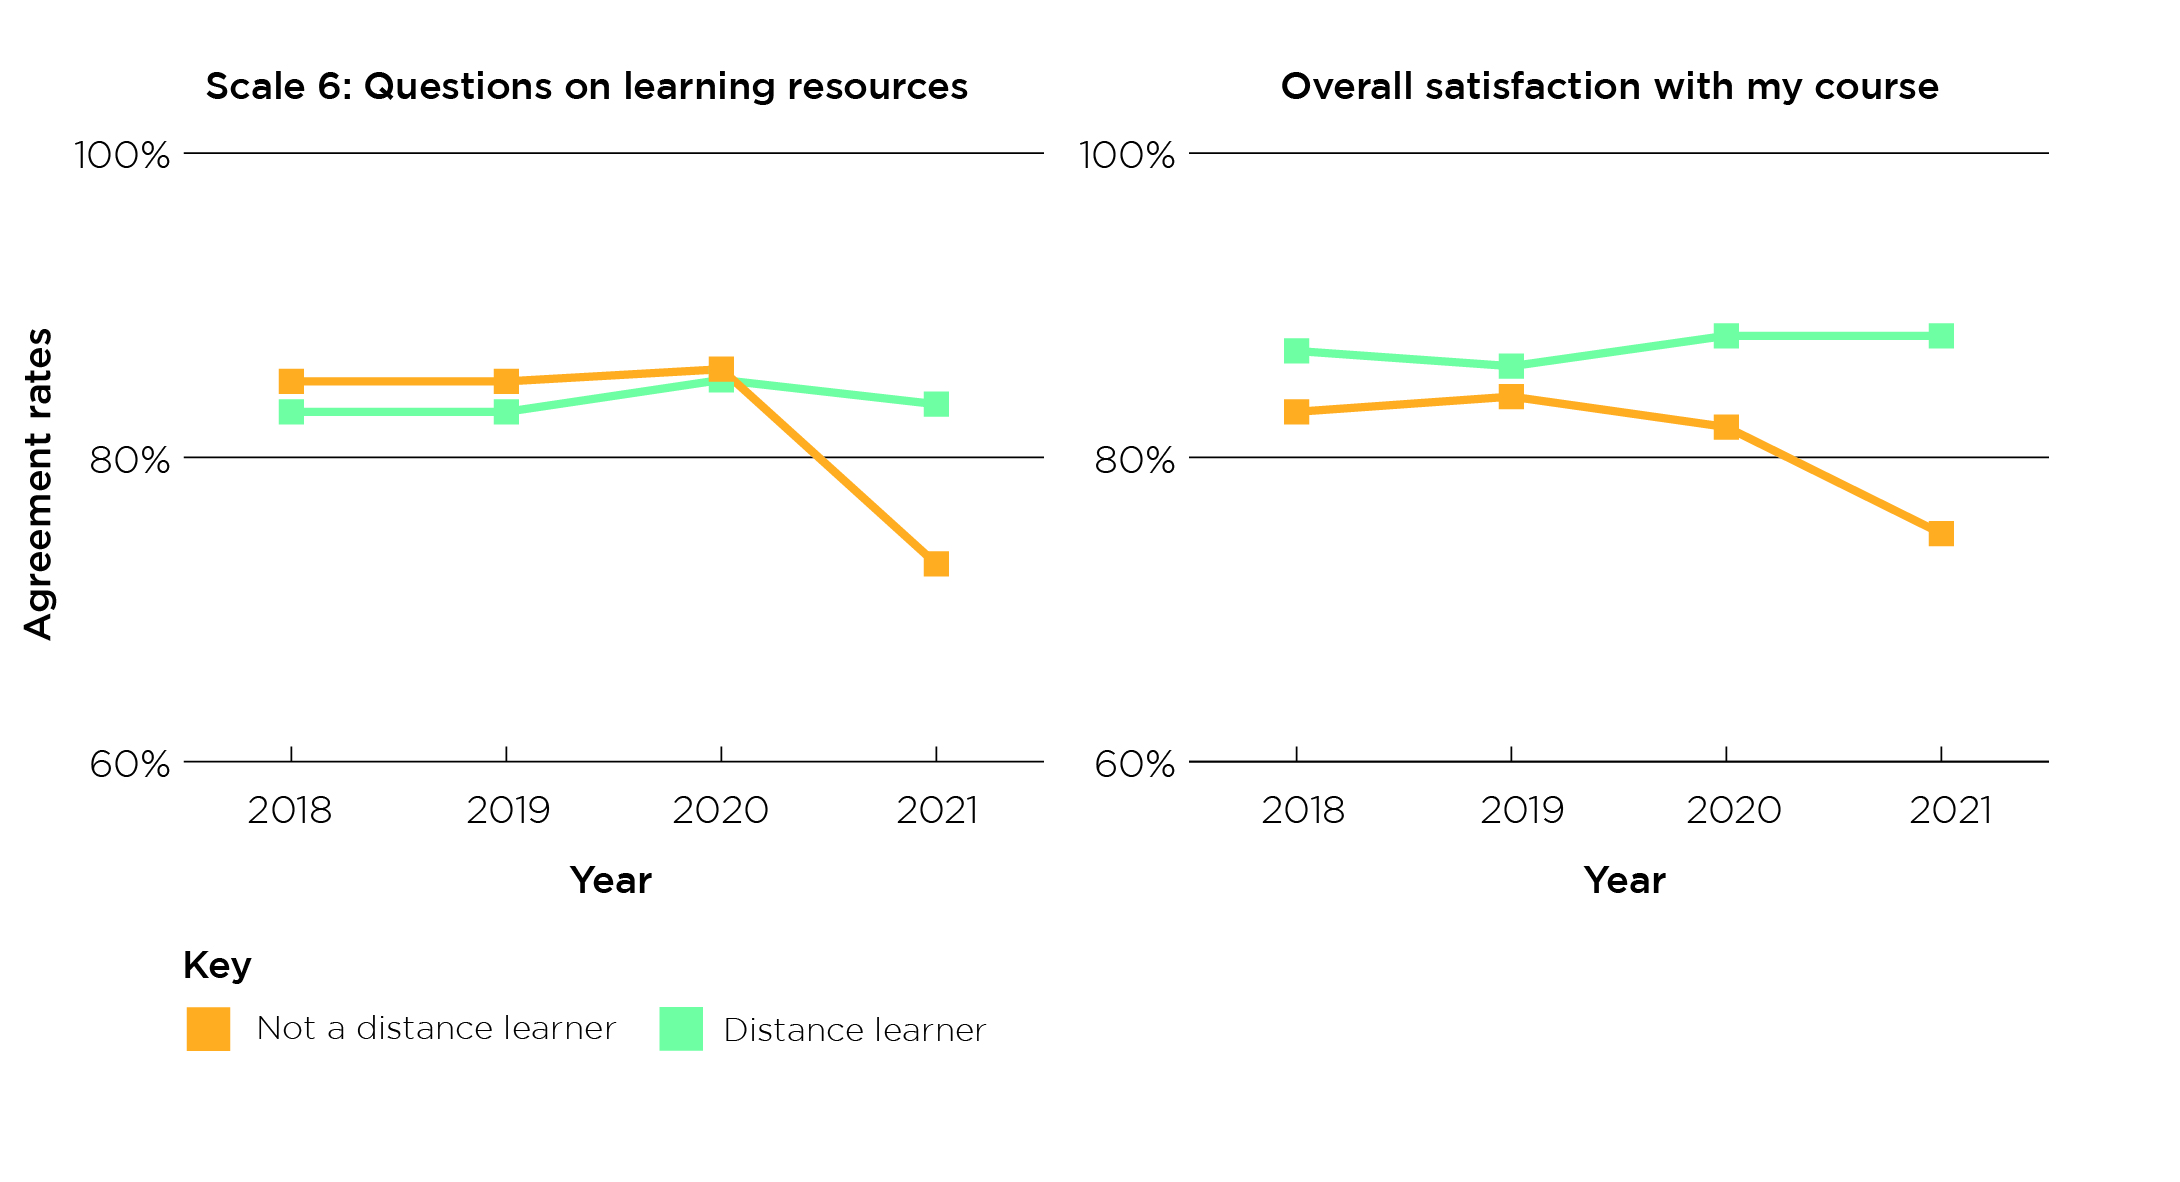
Figure 3 consists of two double line charts. The line charts show that, while distance learners’ agreement rates for Scale 6, ‘Learning resources’ and for overall satisfaction remained stable in 2021, the rate for those who are not a distance learner declined sharply.
The line chart for Scale 6: Questions on learning resources shows that:
- In 2018, the agreement rate for those who are not a distance learner was 85.5 per cent and 83.4 per cent for a distance learner.
- In 2019, the agreement rate for those who are not a distance learner was 85.9 per cent and 83.5 per cent for a distance learner.
- In 2020, the agreement rate for those who are not a distance learner was 85.8 per cent and 85.1 per cent for a distance learner.
- In 2021, the agreement rate for those who are not a distance learner was 73.0 per cent and 83.5 per cent for a distance learner.
The line chart for Overall satisfaction on my course, shows that:
- In 2018, the agreement rate for those who are not a distance learner was 83.3 per cent and 87.1 per cent for a distance learner.
- In 2019, the agreement rate for those who are not a distance learner was 83.5 per cent and 86.4 per cent for a distance learner.
- In 2020, the agreement rate for those who are not a distance learner was 82.4 per cent and 87.9 per cent for a distance learner.
- In 2021, the agreement rate for those who are not a distance learner was 74.7 per cent and 87.6 per cent for a distance learner.
The fall in agreement rates is seen across all subject areas, but to a varying extent. Focusing on the learning resources scales, the following subject areas are particularly severely affected: agriculture, food and related studies; architecture, building and planning; design and creative and performing arts; geography, earth and environmental studies; language and area studies; and media, journalism and communications. In all these cases, the agreement rate has fallen by between 14 and 16 percentage points.
The subject area with the smallest fall in agreement rates for this scale is combined and general studies, but this is explained by the high proportion of distance learning students. Veterinary sciences on the one hand, and medicine and dentistry on the other, also see relatively small decreases of, respectively, 6.3 percentage points and 6.5 percentage points.
Covid-related questions
Looking at the covid-related questions, students responded fairly positively to the questions about communication and the availability of learning resources (although less positively than they usually do to the core NSS questions). Students responded less positively when asked whether they agreed with the statements ‘My university or college has taken sufficient steps to support my mental wellbeing during the covid-19 pandemic’ (41.9 per cent agreement rate) and ‘I am content with the delivery of learning and teaching of my course during the covid-19 pandemic’ (47.6 per cent agreement rate).
COVID-related questions in the 2021 NSS
- I have received useful information about changes to my course from my university or college during the covid pandemic.
- I have received timely information about changes to my course from my university or college during the covid pandemic.
- My university or college has taken sufficient steps to support my mental wellbeing during the covid pandemic.
- My university or college has taken sufficient steps to protect my physical safety from the virus during the covid pandemic (e.g. providing protective equipment such as masks, social distancing on campus, offering distance learning opportunities).
- I am content with the delivery of learning and teaching of my course during the covid pandemic.
- I have been able to access the learning resources I need (lecture notes, course materials, journals, virtual learning environment) for my course during the covid pandemic.
Figure 4: Overall agreement rate for covid-related questions
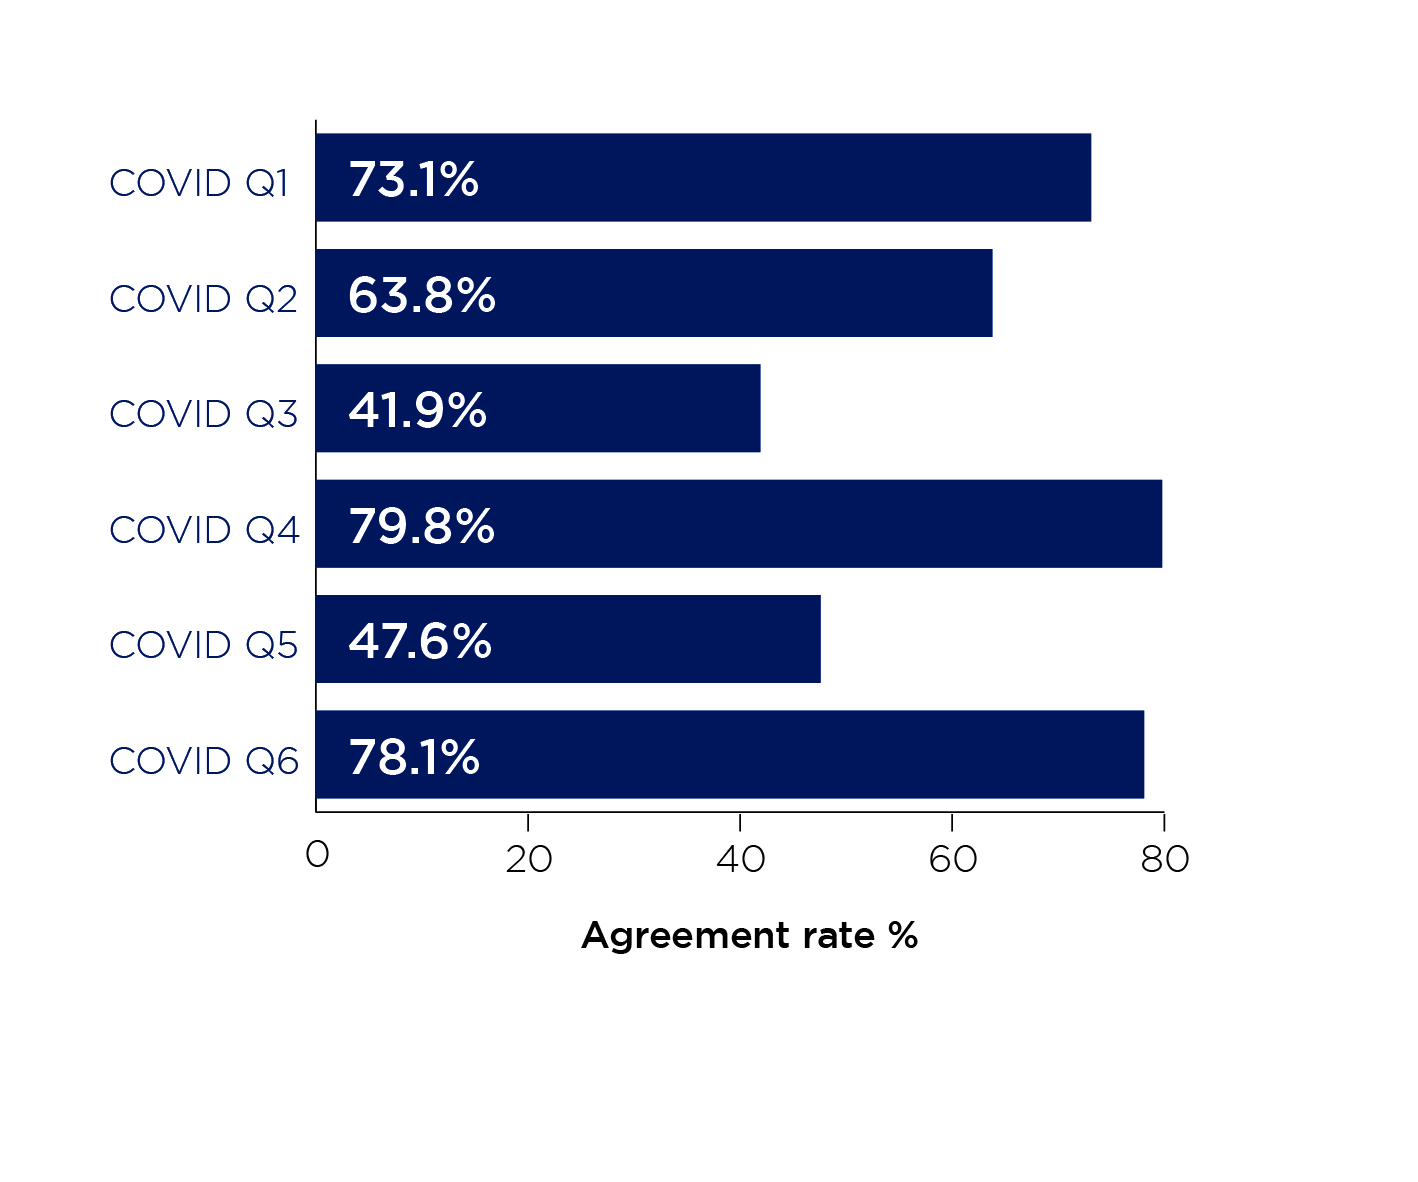
Figure 4 is a bar chart. It shows the agreement rate for all the covid-related questions. It shows that for:
- Question 1 (‘I have received useful information about changes to my course from my university or college during the covid-19 pandemic’), the agreement rate was 73.1 per cent.
- Question 2, (‘I have received timely information about changes to my course from my university or college during the covid-19 pandemic’), the agreement rate was 63.8 per cent.
- Question 3 (‘My university or college has taken sufficient steps to support my mental wellbeing during the covid-19 pandemic’), the agreement rate was 41.9 per cent.
- Question 4 (‘My university or college has taken sufficient steps to protect my physical safety from the virus during the covid-19 pandemic (e.g. providing protective equipment such as masks, social distancing on campus, offering distance learning opportunities)’), the agreement rate was 79.8 per cent.
- Question 5 (‘I am content with the delivery of learning and teaching of my course during the covid-19 pandemic’), the agreement rate was 47.6 per cent.
- Question 6 (‘I have been able to access the learning resources I need (lecture notes, course materials, journals, virtual learning environment) for my course during the covid-19 pandemic’), the agreement rate was 78.1 per cent.
As with the core NSS questions, distance learning students responded more positively to the covid-related questions than other students. For example, 79.9 per cent of distance learning students agreed that they were content with the delivery of learning and teaching on their course during the pandemic, compared with 46 per cent of students who would usually be engaged in face-to-face learning.
This difference is reflected in the results for many other student groupings. For example, older students and part-time students responded more positively to this question, but again this difference appears to be mainly due to the higher proportion of older and part-time students studying through distance learning.
As with the core NSS questions, responses vary across subject areas. For example, UK-domiciled students of media, journalism and communications, and of design and creative and performing arts, are less likely to agree with the statement ‘I am content with the delivery of learning and teaching of my course during the covid-19 pandemic’ (37.6 per cent and 40.0 per cent, respectively). Setting aside ‘Combined and general studies’, as above, the subject areas with the highest agreement rates for this question are veterinary science (62.1 per cent) and medicine and dentistry (64.7 per cent.)
Understanding the impact of the pandemic
The data cannot tell us whether the fall in NSS agreement rates is due to the pandemic. But this explanation appears the most likely, given the previous stability of the results and the exceptional changes to higher education and students’ lives since March 2020. This is further supported by the fact that the fall in agreement rates is confined to students who would usually be studying face-to-face – that is, those students whose studies have been most affected by covid restrictions.
We know that the pandemic was in the minds of many students when they responded to the survey. As part of the survey, students are asked whether there are particularly positive or negative aspects of their experience they would like to highlight. Of the students who responded to this question, 27.5 per cent mentioned the pandemic, generally as a negative aspect of their experience. Mentions of the pandemic were spread evenly throughout the survey window.
We were interested in understanding how decreases in agreement rates were related to responses to the covid-related questions. We looked at this as a way of understanding which aspects of a provider’s response to the pandemic most affected the student’s perceptions of their experience. We focused here on the relation between Question 27 (overall satisfaction) and the six covid questions. We found that changes in Question 27 could be best predicted by the fifth covid question (‘I am content with the delivery of learning and teaching of my course during the covid-19 pandemic’). Providers with lower agreement rates for this question tended to see greater falls in reported overall satisfaction.
Comparing responses to the NSS questions with responses to the covid questions at the level of individual students, we found a weak to moderate level of correlation, as shown in Figure 5. The strongest correlation is between covid question 5 (learning and teaching) and core question 27 (overall satisfaction). The moderate correlations between covid 3 (mental wellbeing) and the core NSS questions are interesting, given that the core NSS questions do not directly address issues of mental health. The overall level of correlation suggests that students’ experiences during the pandemic influenced their responses to the core questions, but did not entirely determine them. This may be because students reflect upon their entire course when answering the core questions, rather than only the portion of the course affected by the pandemic.
Figure 5: Correlations between core questions and covid-related questions
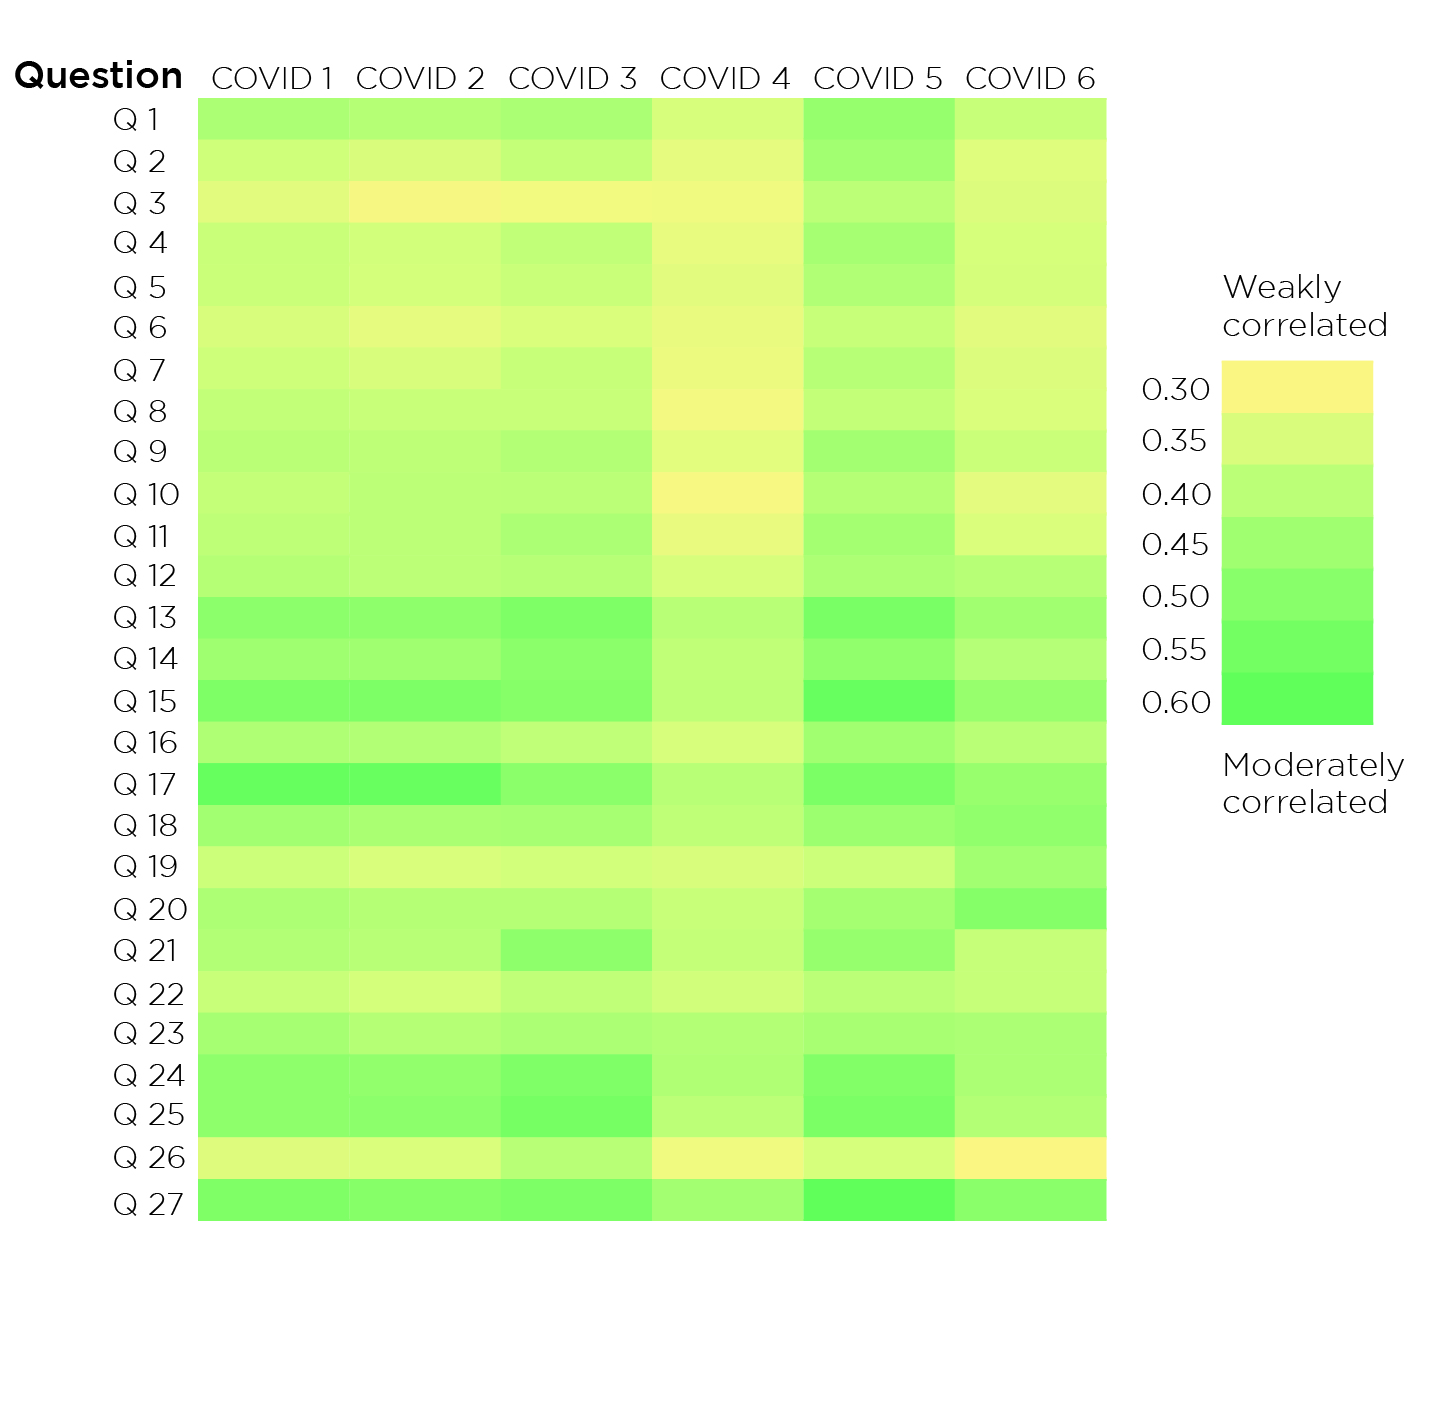
Note: The colours in Figure 5 reflect the Spearman correlation coefficient. All correlations were found to be significant above the 99 per cent level.
Figure 5 is a heat map showing the correlations between core questions and covid-related questions. The correlations range from weakly correlated (0.3) to moderately correlated (0.6). The strongest correlation is between covid question 5 (learning and teaching) and core question 27 (overall satisfaction).
It shows that for:
- Question 1, correlation with COVID-1 is 0.43, with COVID-2 it is 0.42, with COVID-3 it is 0.44, with COVID-4 it is 0.37, with COVID-5 it is 0.47, and with COVID-6 it is 0.39.
- Question 2, correlation with COVID-1 is 0.38, with COVID-2 it is 0.37, with COVID-3 it is 0.40, with COVID-4 it is 0.35, with COVID-5 it is 0.45, and with COVID-6 it is 0.36.
- Question 3, correlation with COVID-1 is 0.35, with COVID-2 it is 0.33, with COVID-3 it is 0.33, with COVID-4 it is 0.34, with COVID-5 it is 0.41, and with COVID-6 it is 0.36.
- Question 4, correlation with COVID-1 is 0.39, with COVID-2 it is 0.38, with COVID-3 it is 0.40, with COVID-4 it is 0.35, with COVID-5 it is 0.44, and with COVID-6 it is 0.37.
- Question 5, correlation with COVID-1 is 0.39, with COVID-2 it is 0.37, with COVID-3 it is 0.39, with COVID-4 it is 0.36, with COVID-5 it is 0.43, and with COVID-6 it is 0.37.
- Question 6, correlation with COVID-1 is 0.37, with COVID-2 it is 0.35, with COVID-3 it is 0.36, with COVID-4 it is 0.34, with COVID-5 it is 0.39, and with COVID-6 it is 0.35.
- Question 7, correlation with COVID-1 is 0.38, with COVID-2 it is 0.37, with COVID-3 it is 0.39, with COVID-4 it is 0.34, with COVID-5 it is 0.42, and with COVID-6 it is 0.36.
- Question 8, correlation with COVID-1 is 0.40, with COVID-2 it is 0.39, with COVID-3 it is 0.39, with COVID-4 it is 0.33, with COVID-5 it is 0.40, and with COVID-6 it is 0.36.
- Question 9, correlation with COVID-1 is 0.41, with COVID-2 it is 0.41, with COVID-3 it is 0.42, with COVID-4 it is 0.35, with COVID-5 it is 0.45, and with COVID-6 it is 0.39.
- Question 10, correlation with COVID-1 is 0.40, with COVID-2 it is 0.41, with COVID-3 it is 0.41, with COVID-4 it is 0.32, with COVID-5 it is 0.42, and with COVID-6 it is 0.35.
- Question 11, correlation with COVID-1 is 0.41, with COVID-2 it is 0.41, with COVID-3 it is 0.44, with COVID-4 it is 0.34, with COVID-5 it is 0.45, and with COVID-6 it is 0.36.
- Question 12, correlation with COVID-1 is 0.42, with COVID-2 it is 0.41, with COVID-3 it is 0.42, with COVID-4 it is 0.37, with COVID-5 it is 0.43, and with COVID-6 it is 0.42.
- Question 13, correlation with COVID-1 is 0.49, with COVID-2 it is 0.49, with COVID-3 it is 0.53, with COVID-4 it is 0.42, with COVID-5 it is 0.54, and with COVID-6 it is 0.46.
- Question 14, correlation with COVID-1 is 0.46, with COVID-2 it is 0.46, with COVID-3 it is 0.50, with COVID-4 it is 0.40, with COVID-5 it is 0.49, and with COVID-6 it is 0.42.
- Question 15, correlation with COVID-1 is 0.52, with COVID-2 it is 0.53, with COVID-3 it is 0.51, with COVID-4 it is 0.41, with COVID-5 it is 0.58, and with COVID-6 it is 0.47.
- Question 16, correlation with COVID-1 is 0.43, with COVID-2 it is 0.42, with COVID-3 it is 0.40, with COVID-4 it is 0.37, with COVID-5 it is 0.46, and with COVID-6 it is 0.41.
- Question 17, correlation with COVID-1 is 0.58, with COVID-2 it is 0.58, with COVID-3 it is 0.50, with COVID-4 it is 0.42, with COVID-5 it is 0.53, and with COVID-6 it is 0.47.
- Question 18, correlation with COVID-1 is 0.45, with COVID-2 it is 0.44, with COVID-3 it is 0.44, with COVID-4 it is 0.41, with COVID-5 it is 0.46, and with COVID-6 it is 0.49.
- Question 19, correlation with COVID-1 is 0.38, with COVID-2 it is 0.36, with COVID-3 it is 0.38, with COVID-4 it is 0.37, with COVID-5 it is 0.38, and with COVID-6 it is 0.45.
- Question 20, correlation with COVID-1 is 0.43, with COVID-2 it is 0.42, with COVID-3 it is 0.42, with COVID-4 it is 0.39, with COVID-5 it is 0.45, and with COVID-6 it is 0.51.
- Question 21, correlation with COVID-1 is 0.43, with COVID-2 it is 0.42, with COVID-3 it is 0.49, with COVID-4 it is 0.40, with COVID-5 it is 0.48, and with COVID-6 it is 0.39.
- Question 22, correlation with COVID-1 is 0.39, with COVID-2 it is 0.37, with COVID-3 it is 0.40, with COVID-4 it is 0.38, with COVID-5 it is 0.47, and with COVID-6 it is 0.39.
- Question 23, correlation with COVID-1 is 0.45, with COVID-2 it is 0.42, with COVID-3 it is 0.43, with COVID-4 it is 0.42, with COVID-5 it is 0.44, and with COVID-6 it is 0.44.
- Question 24, correlation with COVID-1 is 0.49, with COVID-2 it is 0.48, with COVID-3 it is 0.52, with COVID-4 it is 0.43, with COVID-5 it is 0.51, and with COVID-6 it is 0.43.
- Question 25, correlation with COVID-1 is 0.49, with COVID-2 it is 0.49, with COVID-3 it is 0.54, with COVID-4 it is 0.41, with COVID-5 it is 0.53, and with COVID-6 it is 0.42.
- Question 26, correlation with COVID-1 is 0.36, with COVID-2 it is 0.36, with COVID-3 it is 0.42, with COVID-4 it is 0.33, with COVID-5 it is 0.37, and with COVID-6 it is 0.32.
- Question 27, correlation with COVID-1 is 0.52, with COVID-2 it is 0.51, with COVID-3 it is 0.53, with COVID-4 it is 0.45, with COVID-5 it is 0.60, and with COVID-6 it is 0.50.
Additional data and analysis
We have published the full results of the NSS core questions and covid-related questions. We have also made available the analysis we carried out when assessing the reliability of the NSS 2021 results, including interactive versions of the charts in this brief.
We have also released as an experimental statistic agreement rates for the core questions based on data from the three previous years (2019, 2020 and 2021). We hope that this three-year statistic will be helpful to data users who want a broader view of the student experience, including results unaffected by the pandemic. We particularly welcome feedback on this new statistic.9
We have published the additional analysis and the three-year average alongside the NSS results.10
What the OfS is doing
Over the last year, the OfS has undertaken a review of the future of the NSS. The review follows a request by the Minister of State for Universities to address concerns about how the NSS may be creating burden and affecting standards, while ensuring that it remains an important indicator of student experience.
The first stage of this review has already been completed.11 The second stage will look more widely at the role of the NSS, including which questions should be asked to support regulation and student information across all four countries of the UK. We will consider and consult on:
- Potential changes to the questions of the NSS to ensure they remain relevant and fit for purpose, now and in the future
- Potential changes to the publication of NSS data, including the reporting thresholds, to ensure it meets the needs of users and is easy to understand
- Improved guidance to assist universities, colleges and students’ unions on the responsible statistical use of the NSS
- Improved data visualisation and functionality of the NSS dissemination site
- Increased awareness of what constitutes inappropriate influence on students’ responses and how to report it.
This phase will include stakeholder workshops and sector-wide consultation. New questions will be comprehensively tested, including cognitive testing with students, and we aim to pilot the changes alongside the 2022 NSS. Any changes to questions will be subject to consultation. We will aim to launch any new survey questions for NSS 2023. A revised data dissemination site is planned for launch in time for the 2023 survey results.
This year we are also publishing alongside the main data a more experimental release, which contains a statistic for each provider based on its NSS results for the past three years. This may be useful to those who are interested in universities’ and colleges’ performance over a longer period of time, rather than just during the pandemic.
Other polls and surveys
Throughout the covid pandemic, the OfS has looked at external trends, including polls and reports with data on student and sector responses to the pandemic. We have also conducted our own polling.
Office for Students, Student polling for Digital Teaching and Learning Review, 18 November to 3 December 2020. Questions related to how the pandemic had impacted teaching in higher education and how it has changed attitudes to digital teaching and learning. Two online surveys were carried out by YouGov which sampled, respectively, 1,285 students and 567 teaching staff. The figures were weighted to make the sample more representative of English students.12
Higher Education Policy Institute, Student Academic Experience Survey 2021, 2 February to 22 March 2021. Now in its 15th year, the Student Academic Experience Study asks about – among other topics – teaching quality, students’ priorities and their wellbeing. The survey was sent to the YouthSight panel. In total, 10,186 responses were collected, representing a response rate of 21.35 per cent.13
Office for National Statistics, Coronavirus and higher education students: England, 24 May to 2 June 2021: Experimental statistics from the Student COVID-19 Insights Survey in England. The publication includes information on the behaviours, plans, opinions and wellbeing of higher education students in the context of guidance on COVID-19. A total of 100,000 students in English universities were invited to take part, with a response rate of 1.1 per cent.14
Conclusion
The National Student Survey has been used for 16 years as a tool for measuring student experience, and the NSS 2021 provides a useful measure of the impact of the pandemic on that experience. The data it provides will help the OfS and other stakeholders to respond and adapt to the challenges that have arisen during the past year.
However, given the circumstances under which the survey was undertaken, the data should be used with sensitivity and caution. The decline in positive responses to the summary question at a provider level, for instance, could be short-lived, and might rebound once the pandemic eases. Prospective students wanting information about a specific course should bear in mind that these figures represent a snapshot of the student experience at a particular point in time.
The findings from NSS 2021, and the wider lessons learned during the pandemic, will inform the OfS’s future approach to its regulation of universities and colleges. They will also inform future surveys – changes could include expanding the number of eligible students, asking new questions, or updating how we display data. All of these actions will draw on our new knowledge to allow us and the sector to better meet students’ needs under the current exceptional circumstances, and during any future periods of sudden and unexpected change.
1 Throughout this brief, for clarity and consistency, we refer throughout to ‘covid’ rather than ‘COVID-19’ or ‘coronavirus’.
2 In this brief, for the sake of readability, we have used ‘universities and colleges’, or sometimes simply ‘universities’, to refer to what our regulatory framework and other more formal documents call ‘higher education providers’.
3 Lewis, Martin, and Little, Alison, ‘The National Student Survey: The University of Sheffield Library’, in Jeremy Atkinson (ed.), Quality and the academic library: Reviewing, assessing and enhancing service provision, 2016, pp101-110; Tuck, Jackie, ‘Academics engaging with student writing: Working at the higher education textface’, 2017, p102; Buckley, A, ‘Making it count: Reflecting on the National Student Survey in the process of enhancement’, 2012, pp33-34; Brown, Sally, ‘Bringing about positive change in the higher education student experience: A case study’, Quality Assurance in Education, 2011, pp195-207.
4 See Discover Uni, ‘Compare courses’ (https://discoveruni.gov.uk/course-comparison/).
5 OfS, ‘The National Student Survey: Consistency, controversy and change’ (OfS Insight brief #6), February 2020 (available at www.officeforstudents.org.uk/publications/the-national-student-survey-consistency-controversy-and-change/).
6OfS, ‘National Student Survey 2020: Analysis of the impact of the coronavirus pandemic’ (OfS 2020.37), July 2020 (available at www.officeforstudents.org.uk/publications/nss-2020-analysis-of-impact-of-coronavirus/).
7 OfS, ‘The National Student Survey 2021: Guidance’ (OfS 2020.47), October 2020 (available at www.officeforstudents.org.uk/publications/nss-2021/), p3.
8 All the data that follows is taken from OfS analysis of the NSS data, and relates to students at all higher education providers across the UK. Interactive versions of the charts, and more analysis, are available at www.officeforstudents.org.uk/advice-and-guidance/student-information-and-data/national-student-survey-nss/. Given the lower response rates for the covid-related questions, we assessed the impact of non-response bias, and found that the estimates would not be materially changed by weighting to correct for differential response rates.
9 Feedback should be sent to [email protected].
10Available at www.officeforstudents.org.uk/advice-and-guidance/student-information-and-data/national-student-survey-nss/.
11 OfS, ‘NSS review: Phase one report’ (OfS 2021.05), March 2021 (available at www.officeforstudents.org.uk/publications/nss-review-phase-one-report/).
12 Available at www.officeforstudents.org.uk/publications/gravity-assist-propelling-higher-education-towards-a-brighter-future/.
13 Available at https://www.hepi.ac.uk/2021/06/24/the-student-academic-experience-survey-2021/.
Describe your experience of using this website