English higher education 2020: The Office for Students annual review
Supporting all students to succeed
Fairness and opportunity in access to higher education are more important than ever before. As we have seen during the coronavirus pandemic, they are central to the ambitions and expectations of families and communities throughout the country. Universities and colleges have ambitious plans that set out how, over the next five years, they will support the most disadvantaged students to access their courses, thrive in their studies and progress into graduate careers.
The OfS agrees and oversees these plans, and their delivery. We agreed new plans last year which, if realised, will see an extra 6,500 disadvantaged students each year entering those universities with the highest entrance requirements. There have been improvements at high-tariff providers this year and the challenge will be to build on that progress in the future.64 While these plans have been disrupted by the pandemic, the OfS is working with providers to get them back on track. Where a student comes from, their identity or their life experience should not determine their chances of getting into a course, completing it successfully, and progressing to a successful career or to further study.
Despite progress in recent years, however, this is still not happening sufficiently. Certain groups remain underrepresented in higher education, and gaps in access and outcomes for disadvantaged students persist. The pandemic has thrown existing social and economic inequalities into stark relief. Its impact, and the effect of lockdown, have also given rise to new disparities. School closures during the first lockdown are expected to have exacerbated inequalities and widened the existing attainment gap between disadvantaged children and their peers.65
Similarly, in higher education it appears that students with disadvantaged backgrounds or specific needs are being more adversely impacted by the pandemic. During the first lockdown, the move to online teaching benefitted some students more than others.66 The mental health and wellbeing of students during lockdown have been at risk.67 Unequal access to computers and the internet means that some students have struggled to access lectures and seminars.68
Universities and colleges have risen to these various challenges – adapting learning and teaching approaches, moving welfare services online, offering careers advice remotely, and ensuring exams are accessible. Open days have gone virtual and Uni Connect partnerships have continued to provide advice to the most disadvantaged. Students’ unions have distributed food parcels and delivered essential goods to students who are shielding.
We have worked with providers throughout this period to support them in meeting these challenges. While we have been clear that they should continue wherever possible to honour the commitments in their access and participation plans, we know that the pandemic has disrupted the delivery of 2019-20 plans, and is likely to affect activity during at least the first year of plans for 2020-21 onwards. In summer and autumn 2020 we gathered sector-wide evidence to help us understand the nature of this disruption. This has informed our continuing approach to access and participation plan regulation.
Access and participation during the pandemic
In March 2020, when the first lockdown began, the OfS highlighted a number of student groups who were likely to be especially vulnerable to its effects: those suffering from coronavirus or who needed to self-isolate, international students, students who had experienced care or were estranged from their families, and disabled students.69 These students required support during the early days of the pandemic for various reasons – for example, because of specific support needs or difficulties in finding alternative accommodation if needed.
As the pandemic developed, it became clear that other groups were vulnerable. Black, Asian and minority ethnic groups have been disproportionately impacted by the virus;70 all students without family support were at greater risk of not having adequate accommodation or pastoral support;71 postgraduate research students were struggling to complete their degrees on time; students who were lesbian, gay, bisexual, transgender or of other minority sexualities or gender identities (LGBT+) may have had to move to live with unaccepting friends or family, or have restricted access to healthcare.72 We produced briefing notes on students without family support and postgraduate students, to offer advice to students and providers. We also published a number of case studies about what universities and colleges were doing to support minority ethnic and LGBT+ students.73
Our approach to access and participation during this time focused on giving providers the time and resources to protect their most vulnerable students. We suspended routine monitoring activity of 2018-19 access agreements and 2019-20 access and participation plans, while making clear our expectations that the commitments in the plans should continue to be met. In particular, financial commitments made to current and future students in these plans could provide vital support to vulnerable students.
We allowed universities and colleges some flexibility in using Uni Connect funds they had committed to activity affected by the closure of schools, including using them to address the hardship and mental health needs of disabled students. Providers are also able to use their student and disabled student premiums to boost mental health support and hardship funds, and use formula capital funding to secure remote IT access for students. We helped set up Student Space, to support students in managing their mental health during the pandemic.
Disabled Students’ Commission
The Disabled Students’ Commission (DSC) was announced by the government in June 2019 to take forward the work of the Disabled Students Sector Leadership Group. Professor Geoff Layer was appointed DSC chair as part of this announcement. The OfS nominated Chris Millward, the OfS’s Director for Fair Access and Participation, as commissioner. Late last year, the OfS ran a recruitment campaign for individual commissioners, and invited organisations to apply to host the commission. In February, the six commissioners were formally appointed, including two student voice commissioners. Advance HE was appointed to host the commission.
The DSC quickly adapted in response to the pandemic by working with practitioners, students, and sector leaders through a series of roundtables to understand the specific challenges for disabled students. This work was published in July in a booklet, ‘Three months to make a difference’. Included in this booklet was a request, which we have accepted, that the OfS consider providers’ responses to the commission’s recommendations in our access and participation plan monitoring for 2019-20.74
Renewing access and participation
With universities and colleges having put in place responses to limit the spread of coronavirus, we are returning to our usual regulation of access and participation. This will allow the OfS to assess properly how providers have sought to meet their commitments. We will, however, acknowledge the circumstances when assessing whether a provider has made reasonable decisions that take into account the needs of students, especially those in underrepresented groups.
In January 2020, we outlined the commitments agreed through our new approach.75 We require every university and college that wants to charge fees up to the higher limit to submit a plan setting out how it will improve equality of opportunity for underrepresented groups to access, succeed in and progress from higher education. These plans must include:
- the provider’s ambition for change
- what it intends to do to achieve that change
- the targets it has set
- the investment it will make to deliver the plan
- how it will evaluate whether the actions in the plan are effective.
Over the last year, we have assessed more than 200 access and participation plans. When assessing these plans, our primary concern is to promote the interests of the most disadvantaged students. Unlike the other regulatory conditions, the baseline requirement for access and participation requires continuous improvement, which relates both to the outcomes achieved and the practice underpinning those outcomes. We monitor each year the delivery of the commitments and targets within plans, including through feedback from students. We are empowered to take action if providers are not taking all reasonable steps to meet their commitments. To help providers with this, we support and promote effective practice, and stimulate collaboration and the sharing of evaluation findings through dedicated OfS access and participation funding.
Funding for access and participation
Funding is a core part of the OfS’s work. It helps us to meet our regulatory objectives by driving improvements in student access, experience and outcomes. Student premium funding contributes towards the aims and objectives set out in providers’ access and participation plans or statements.
For the academic year 2019-20 we have provided funding totalling £332 million for access and participation activity in providers across England, as follows:
- £60 million for the Uni Connect programme
- £40 million for the disabled students premium
- £71 million for the premium to support successful student outcomes for part-time undergraduates
- £161 million for the premium to support successful student outcomes for full-time undergraduates.
We are reviewing our future approach, including in relation to the disabled students premium, where we are taking advice from the Disabled Students’ Commission. We expect to consult on our approach to recurrent funding over the coming year.
Regulating for risk and reducing burden in access and participation plans
The OfS has been clear that provision that presents low risk to students will be subject to less regulatory burden, while less secure elements of provision will face greater regulatory scrutiny.76 This approach gives universities and colleges greater freedom to concentrate on delivering activities that make a real difference to students.
Alongside this approach, we have approved plans for a longer period, up to five years in most cases, rather than the previous annual approach. In making this change, we expected that providers would develop more strategic approaches, and that their plans would therefore contain less detail about specific interventions, and focus more on the outcomes they were trying to achieve. As plans were concerned with the whole student lifecycle, we expected these strategies to involve all parts of the institution, bringing outreach and admissions teams together with colleagues working on student services, learning and teaching, and careers.
What universities and colleges have promised
In their access and participation plans, universities and colleges detail their plans to deal with persistent disparities. Some smaller groups are still critically underrepresented in higher education – for example, care leavers, people estranged from their families, young people from military families, and people from Gypsy, Roma and Traveller communities. Better understanding is needed of the specific and complex barriers students from these groups can face in accessing and succeeding in higher education. The plans also set out how providers are tackling problems such as degree attainment gaps between black and white students, and disabled and non-disabled students.
One of the OfS’s aims is to eliminate the gap in entry rates at high-tariff universities and colleges between the students in the most represented areas and those in the least represented areas (based on Participation of Local Areas (POLAR) quintiles 5 and 1 respectively) by 2038-39.77 Currently, those in the most represented areas are four times more likely to study at a high-tariff provider than those in the least.78
Of the 31 providers classified as high-tariff, 30 included targets relating to this key performance measure (KPM2). The remaining provider has made a commitment to establish a target related to KPM2 during the academic year 2020-21. As shown in Figure 3, if all the universities and colleges with targets in this area meet them, the ratio between the most and least represented groups will reduce from 6.2:1 in 2017-18 to 3.7:1 by 2024-25.79 This would mean around 6,500 more students from the most educationally disadvantaged areas entering high-tariff providers in 2024-25.80
Figure 3: Historical and projected gap and ratio for access to high-tariff providers between POLAR4 quintile 1 and quintile 5 entrants (KPM2)
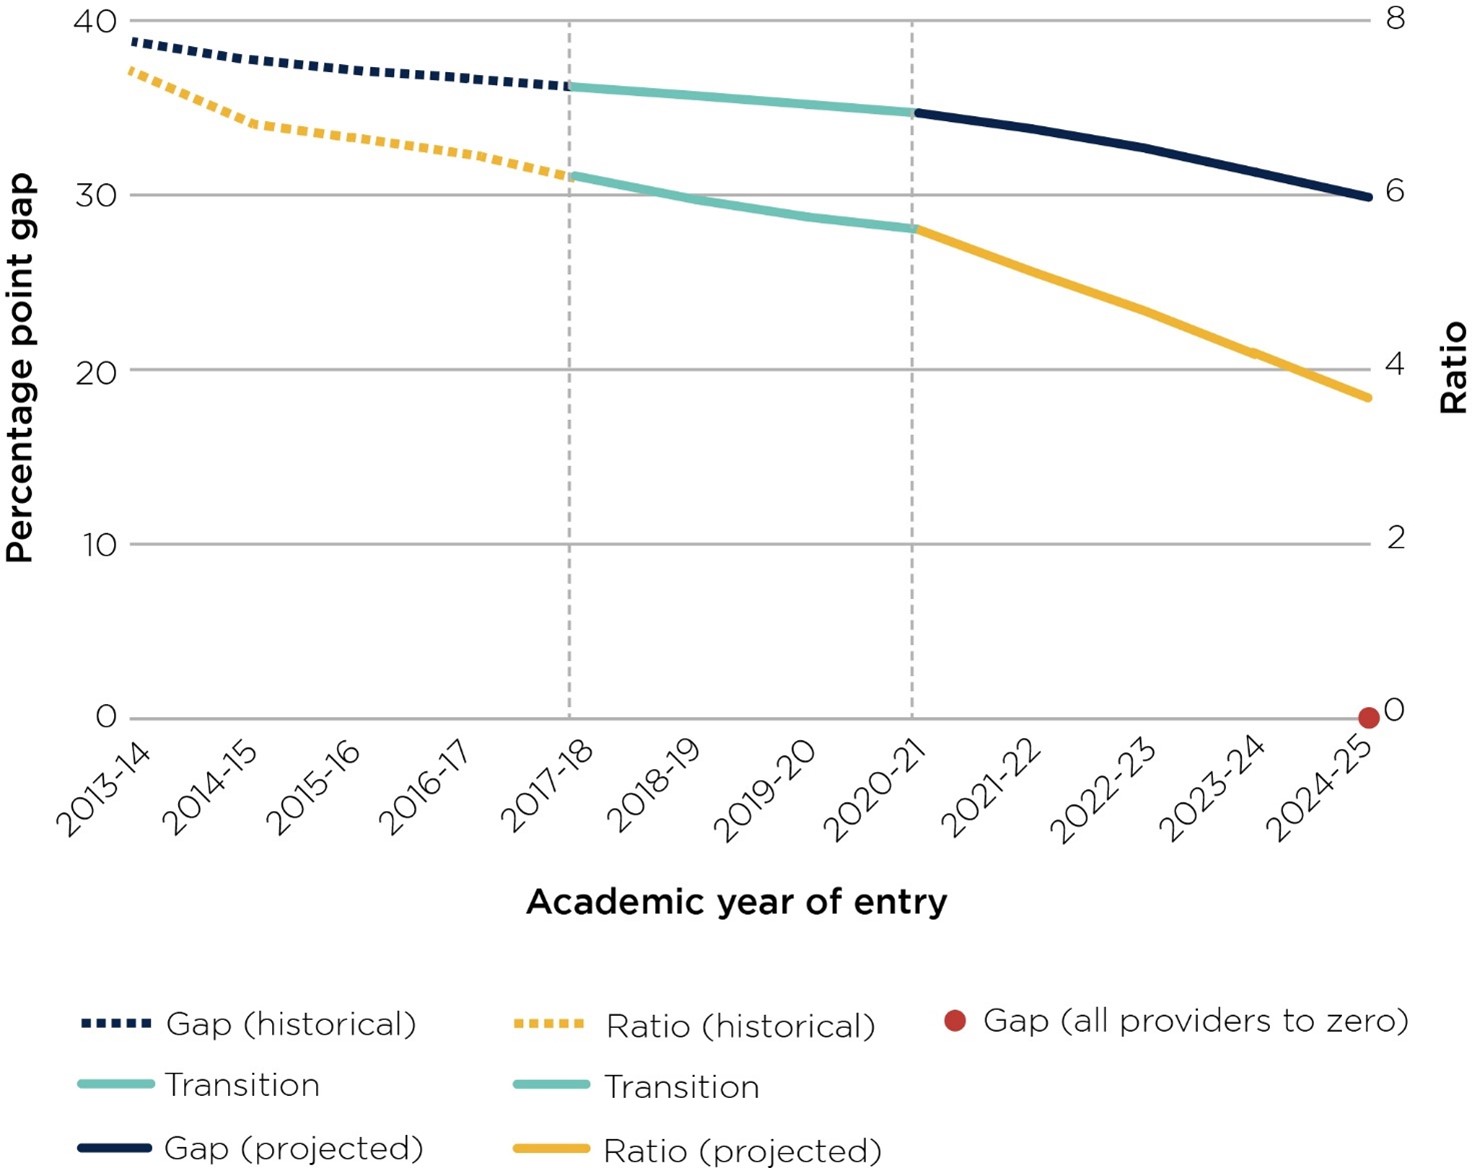
Figure 3 is a double line graph showing the historical and projected gap and ratio for access to high-tariff providers between POLAR4 quintile 1 and quintile 5 entrants.
It shows that, since 2013-14, the percentage point gap and the ratio between POLAR4 quintile 1 and quintile 5 entrants have both declined. They are also projected to keep doing so.
The graph shows:
- In 2013-14, there was a ratio of 7.49 and a percentage point gap of 38.8 between POLAR4 quintile 1 and quintile 5 entrants.
- In 2014-15, there was a ratio of 6.88 and a percentage point gap of 37.8 between POLAR4 quintile 1 and quintile 5 entrants.
- In 2015-16, there was a ratio of 6.70 and a percentage point gap of 37.1 between POLAR4 quintile 1 and quintile 5 entrants.
- In 2016-17, there was a ratio of 6.55 and a percentage point gap of 36.7 between POLAR4 quintile 1 and quintile 5 entrants.
- In 2017-18, it is projected that there was a ratio of 6.24 and a percentage point gap of 36.2 between POLAR4 quintile 1 and quintile 5 entrants.
- In 2018-19, it is projected that there was a ratio of 6.00 and a percentage point gap of 35.7 between POLAR4 quintile 1 and quintile 5 entrants.
- In 2019-20, it is projected that there was a ratio of 5.80 and a percentage point gap of 35.2 between POLAR4 quintile 1 and quintile 5 entrants.
- In 2020-21, it is projected that there will be a ratio of 5.66 and a percentage point gap of 34.7 between POLAR4 quintile 1 and quintile 5 entrants.
- In 2021-22, it is projected that there will be a ratio of 5.17 and a percentage point gap of 33.8 between POLAR4 quintile 1 and quintile 5 entrants.
- In 2022-23, it is projected that there will be a ratio of 4.72 and a percentage point gap of 32.7 between POLAR4 quintile 1 and quintile 5 entrants.
- In 2023-24, it is projected that there will be a ratio of 4.21 and a percentage point gap of 31.3 between POLAR4 quintile 1 and quintile 5 entrants.
- In 2024-25, it is projected that there will be a ratio of 3.72 and a percentage point gap of 29.7 between POLAR4 quintile 1 and quintile 5 entrants.
To achieve their targets, these universities have committed to a range of measures including contextual offers, attainment-raising activity with schools and colleges, and foundation programmes. We welcome the ambition the plans demonstrate, and will monitor them to ensure this ambition is being realised.
Persistent gaps in student outcomes
There are substantial differences in degree attainment rates for certain groups of students. One of the most pressing is the black attainment gap. The attainment rate for black students in 2018-19 was 22.1 percentage points lower than white students. This gap has begun to narrow, down 4.9 percentage points from 2010-11.81 OfS analysis of access and participation plans indicates that, if progress is maintained, we could see equality in degree awarding rates between white and black students by the end of the decade.82
Earlier this year the OfS released an ad hoc experimental analysis on differences in outcomes by student characteristics that we do not routinely publish.83 This experimental data suggests there are stark differences in higher education outcomes for certain groups of students. For example, this analysis found that in 2018-19, students who were eligible to receive free meals when they were at school had a lower rate of achieving a first or upper-second class degree than students who were not eligible. There was an attainment gap of 13.0 percentage points between the two groups.84
We also sought to understand class dynamics by looking at socioeconomic differences. The rate at which students achieve a first or upper-second class degree reduces with socioeconomic classification (NS-SEC) (see Figure 4). Students from intermediate, manual and unemployed backgrounds all have lower attainment rates than students from higher managerial, administrative and professional backgrounds. In 2018-19, the attainment rate of students from an intermediate background was 5.2 percentage points lower than students from a higher managerial, administrative and professional background. The attainment rate of students from a manual background was 8.6 percentage points lower than students from a higher managerial, administrative and professional background. Students from an unemployed background had an attainment rate 21.5 percentage points lower than students from a higher managerial, administrative and professional background.
Figure 4: The differences in rates of achieving a first or upper second class degree by NS-SEC for full-time, UK-domiciled, first degree students and those on undergraduate courses with postgraduate components
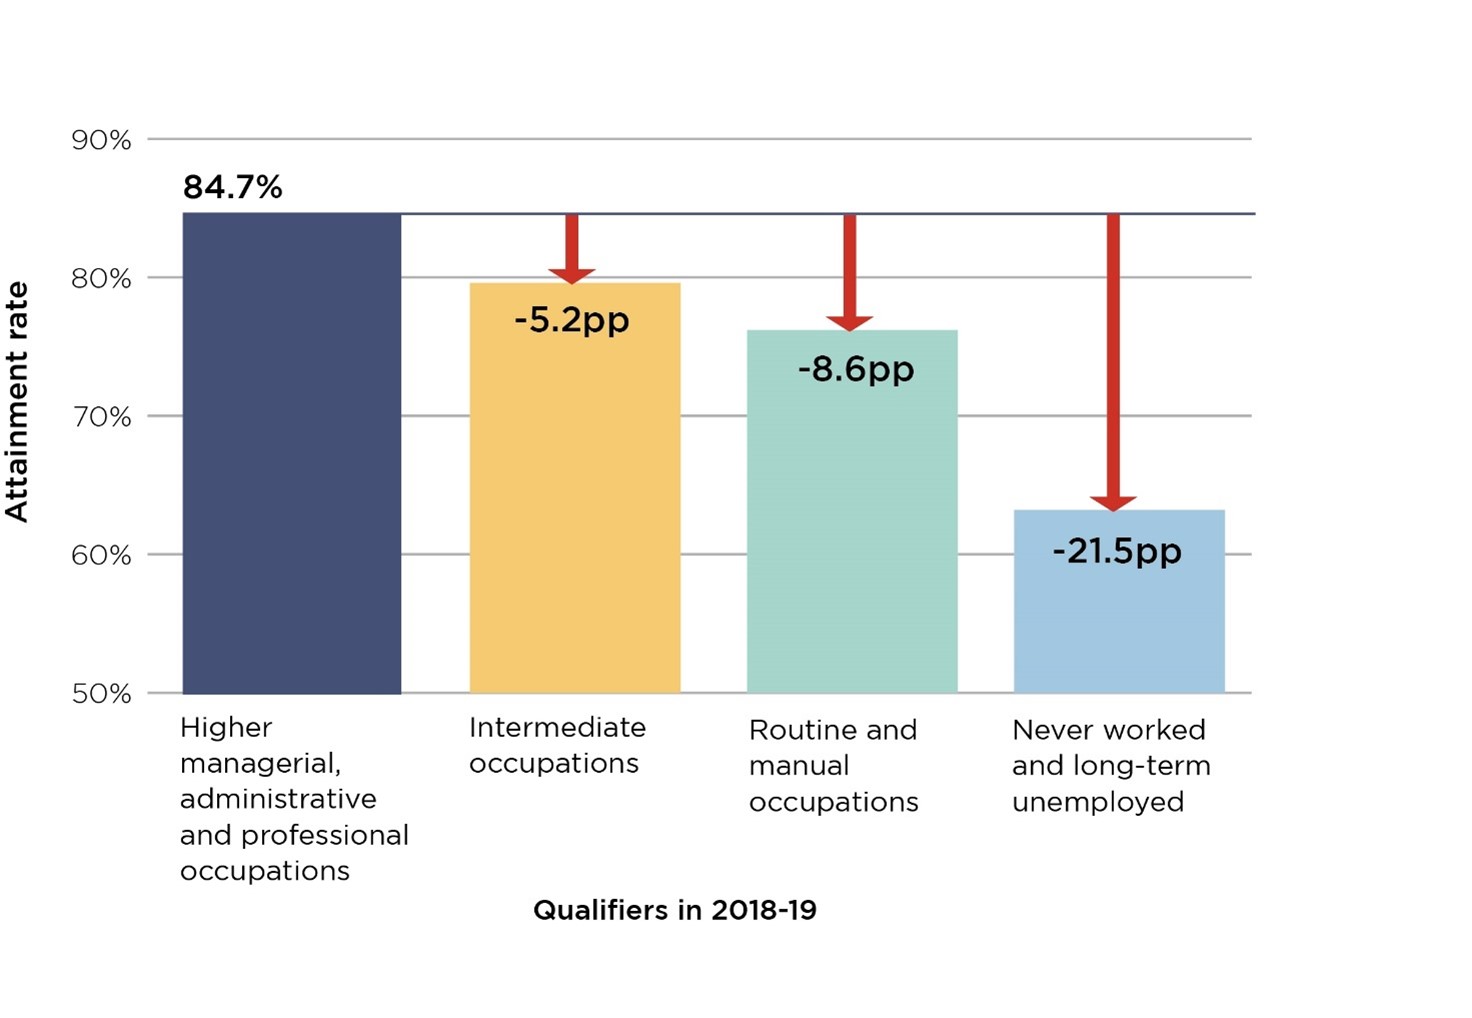
Figure 4 is a bar graph that shows the differences in rates of achieving a first or upper-second class degree by National Statistics socioeconomic classification for full-time, UK-domiciled, first degree students and those on undergraduate courses with postgraduate components. It shows that students from intermediate, manual and unemployed backgrounds all have lower attainment rates than students from higher managerial, administrative and professional backgrounds.
It shows that:
- In 2018-19, 84.7 per cent of students from a higher managerial, administrative and professional background attained a first or upper-second class degree. This was the highest rate.
- In 2018-19, 79.6 per cent of students from an intermediate occupation background attained a first or upper-second class degree. This was a rate 5.2 percentage points lower than for students from a higher managerial, administrative and professional background.
- In 2018-19, 76.2 per cent of students from a routine and manual occupations background attained a first or upper-second class degree. This was a rate 8.6 percentage points lower than for students from a higher managerial, administrative and professional background.
- In 2018-19, 63.2 per cent of students from a 'never worked' and long-term unemployed background attained a first or upper-second class degree. This was a rate 21.5 percentage points lower than for students from a higher managerial, administrative and professional background.
Nor are all graduates equally likely to gain highly skilled employment. Recent analysis by the OfS suggests that in 2016-17, for England-domiciled, undergraduate qualifiers there was a 4.8 percentage point gap between students who were eligible for free school meals and those who were not going on to highly skilled employment or further study at a higher level (see Figure 5).85 These inequalities point to the need for universities and colleges to tailor careers support for students differently, depending on their backgrounds and characteristics.
Figure 5: The difference in students progressing to highly skilled employment or further study at higher level by free school meal eligibility for full-time England-domiciled undergraduate qualifiers
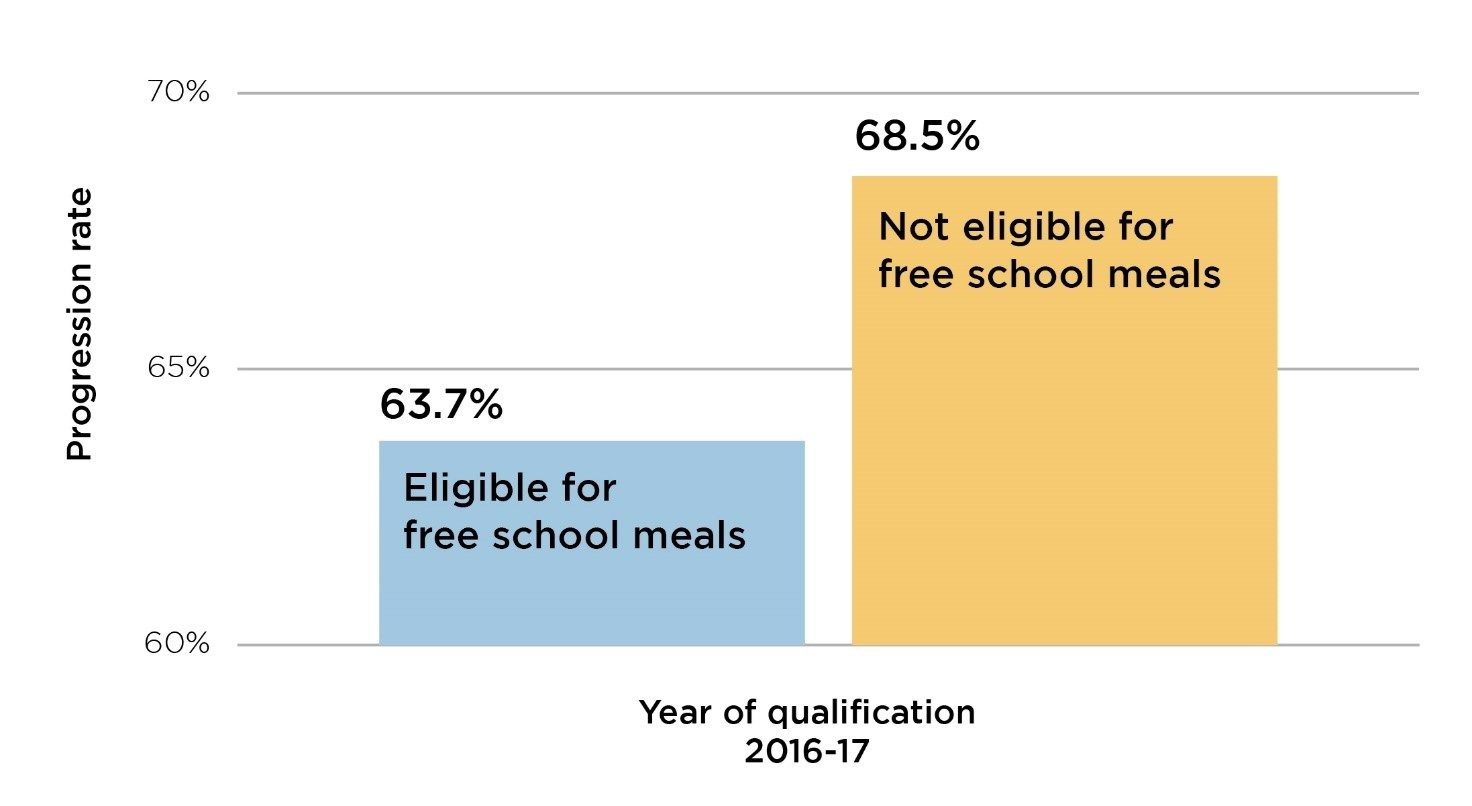
Figure 5 is a double bar graph that shows the difference between students progressing to highly skilled employment or further study at higher level by free school meal eligibility for full-time England-domiciled undergraduate qualifiers in 2016-17. It shows that students not eligible for free school meals have better progression rates that those who were.
Among students who were eligible for free school meals, 63.7 per cent went onto highly skilled employment or further study; of students who were not eligible for free school meals, 68.5 per cent went onto highly skilled employment or further study. The gap between these two rates is 4.8 percentage points.
Student mental health
The mental health and wellbeing of students during the pandemic have been a central concern for providers and the OfS. Like other subsections of the population, some students experienced bereavement, serious illness or other traumatic events, which triggered anxiety, depression or a condition such as post-traumatic stress disorder.86 Different student groups were, and will continue to be, impacted in different ways.
In regulatory guidance published in April 2020 we noted that during this period ‘all students are likely to require increased pastoral support and resources to support their wellbeing,’ and made clear our expectation that universities and colleges should take ‘reasonable steps to put in place equivalent alternative arrangements for such support for all students’.87
Student Space
In addition to the funding flexibilities described at the start of this chapter, we have funded Student Space, a programme run by Student Minds, available from July 2020.88 It is supported by up to £3 million in funding awarded by the OfS. The programme is designed to complement the mental health support already in place through universities, colleges and NHS services in England and Wales – filling potential gaps in provision and ensuring that all students have access to support they need. Providing both preventative support and immediate interventions, Student Space will aim to limit the mental health impact of the pandemic on students and deliver support where it is most needed – for example, for those experiencing distress or trauma. In 2020-21, we plan to conduct a survey on graduate wellbeing.
Mature students and lifelong learning
There has been a significant decline in the number of mature learners entering higher education over the past nine years. While the number of mature students studying full-time has remained largely stable, the number of those studying part-time more than halved between 2010-11 and 2018-19 (see Figure 6).89 Over that time, the mature student population has switched from being roughly 40:60 full-time to part-time students in 2010-11, to being around 60:40 in 2018-19. This suggests that fewer people have access to lifelong learning (especially while also working) and a second chance at entering higher education.
Figure 6: Number of mature undergraduate entrants to English higher education providers90
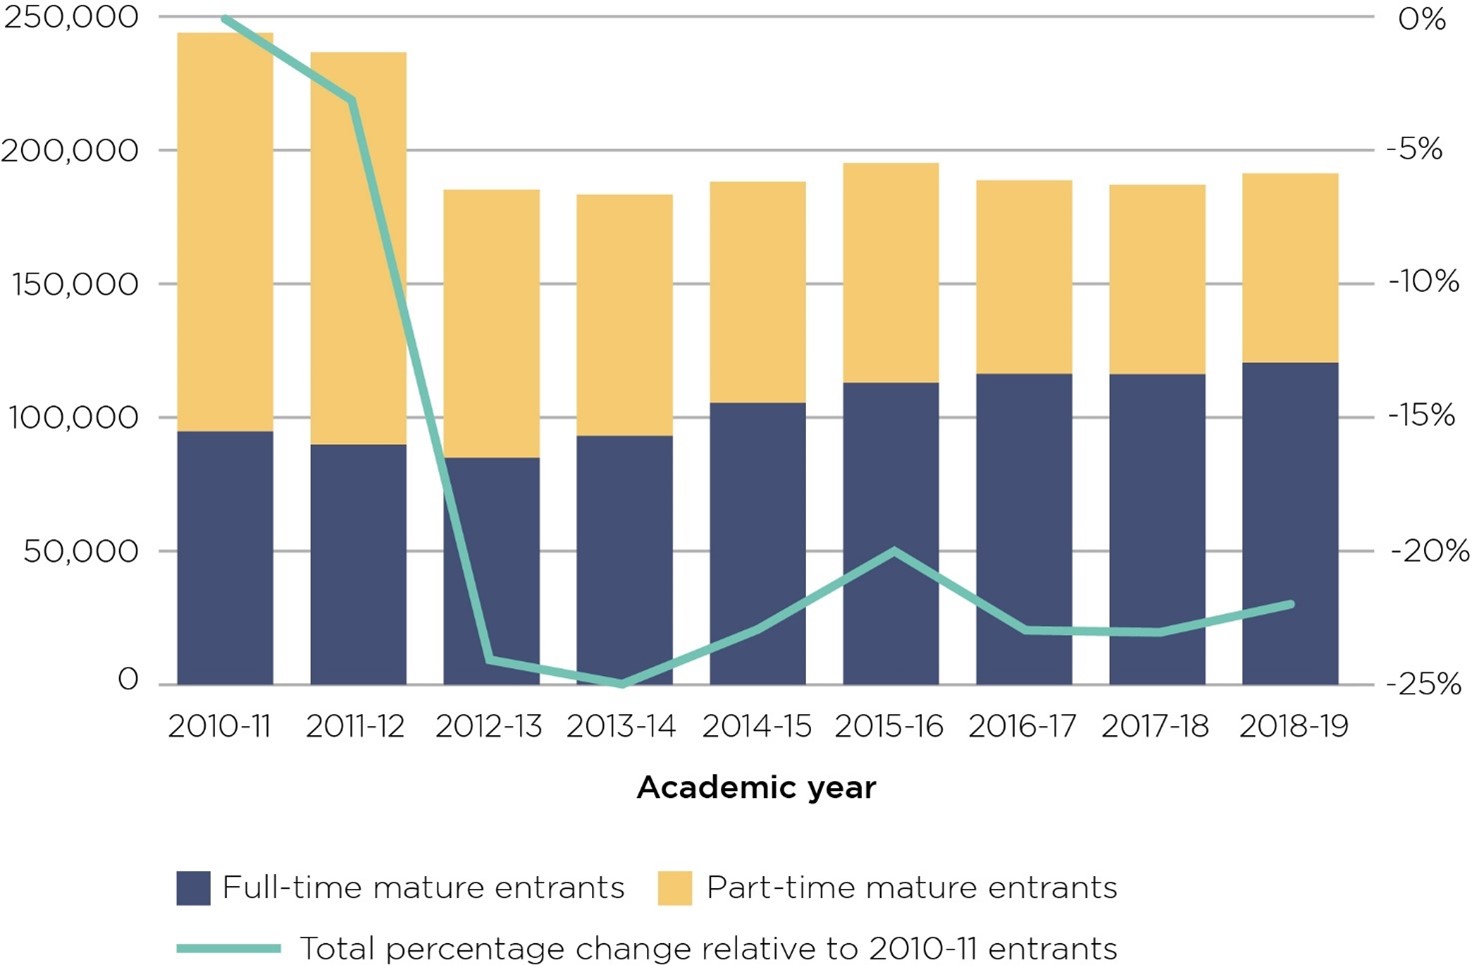
Population: UK-domiciled entrants to undergraduate provision at English higher education providers who are 21 or over.
Figure 6 is a stacked bar graph showing the number of full-time and part-time mature undergraduate entrants to English higher education institutions between 2010-11 and 2018-19. It also has a trendline showing the percentage change relative to 2010-11 entrants.
The graph shows that the number of mature students entering higher education in 2018-19 has declined by 22 per cent relative to 2010-11. This decrease is made up mainly by a marked decline in the number of part-time mature students entering higher education.
The graph shows that:
- In 2010-11, 94,745 full-time and 149,140 part-time mature students entered higher education, a total of 243,885. This is the baseline for the following percentage changes.
- In 2011-12, 89,850 full-time and 146,740 part-time mature students entered higher education, a total of 236,590. The percentage change relative to 2010-11 was a decrease of 3 per cent.
- In 2012-13, 84,860 full-time and 100,385 part-time mature students entered higher education, a total of 185,245. The percentage change relative to 2010-11 was a decrease of 24 per cent.
- In 2013-14, 93,115 full-time and 90,300 part-time mature students entered higher education, a total of 183,410. The percentage change relative to 2010-11 was a decrease of 25 per cent.
- In 2014-15, 105,410 full-time and 82,785 part-time mature students entered higher education, a total of 188,200. The percentage change relative to 2010-11 was a decrease of 23 per cent.
- In 2015-16, 112,985 full-time and 82,190 part-time mature students entered higher education, a total of 195,180. The percentage change relative to 2010-11 was a decrease of 20 per cent.
- In 2016-17, 116,315 full-time and 72,415 part-time mature students entered higher education, a total of 188,730. The percentage change relative to 2010-11 was a decrease of 23 per cent.
- In 2017-18, 116,160 full-time and 70,910 part-time mature students entered higher education, a total of 187,075. The percentage change relative to 2010-11 was a decrease of 23 per cent.
- In 2018-19, 120,460 full-time and 70,880 part-time mature students entered higher education, a total of 191,340. The percentage change relative to 2010-11 was a decrease of 22 per cent.
The OfS’s analysis of access and participation plans has shown that mature students have not been prioritised by many providers, despite low and falling proportions of such students in their own populations and in higher education at large. This suggests that universities and colleges will have to be more proactive, for example by including more flexible study opportunities, to achieve equality in participation rates within a generation.
Mature students are not a homogeneous group and will often have more complex needs than 18-year-olds coming straight from school. They are more likely to have caring responsibilities, come from lower socioeconomic backgrounds, be disabled, or be from black or minority ethnic groups.91 They are also more likely to react to negative financial pressures (such as the prospect of repaying tuition fees, or economic recession) by deciding not to enter higher education.
With the deleterious impact of the pandemic on the economy, this issue is of paramount importance. There will be an increasing demand for adult retraining in an environment where many will be unemployed and need to pursue different career options. After the pandemic, regional economies could look very different: mature students could form the backbone of local economic recovery. As we engage with providers to get their access and participation plans back on track, we will want to consider the support for mature students and their progression through local routes such as further education colleges. This focus on local graduates is expected to be a priority for our funding review.
Harassment and sexual misconduct
Harassment and sexual misconduct remain persistent problems at universities and colleges. Students are more likely than any other group to be sexually assaulted.92 In a recent study of over 6,000 students, nearly 50 per cent of women said they had been touched inappropriately.93 Research from 2017 showed that 26 per cent of Jewish students were very or fairly worried about being subject to verbal abuse, physical attack, vandalism, property damage or theft because of their religious beliefs.94 A study from 2018 showed that one in three Muslim students have experienced some type of abuse or crime where they study.95
In October 2019, a survey commissioned by the Equality and Humans Right Commission revealed that just under a quarter of ethnic minority student respondents had experienced racial harassment since starting their course. Most did not report it to their university.96 This year, reports of harassment and hate crimes directed towards students have continued. Rising ‘anti-Asian-looking’ sentiment has affected international students.97 Students involved in Black Lives Matters protests have highlighted the racism they have experienced in higher education.98 In a letter to international students published in April 2020, Minister of State for Universities Michelle Donelan MP said ‘There is no place in our society – including within higher education – for harassment, discrimination or racism,’ and that the government is working with universities and colleges to ensure they are doing all they can to prevent it.99
In January 2020, the OfS launched a consultation on our expectations about how universities and colleges should prevent and respond to incidents of harassment. This consultation was paused following the coronavirus outbreak, but we expect to return to this as soon as possible in the new year.
We also want students to know how they can report incidents at their university or college, and to feel confident that when they do their complaints will be addressed. Universities UK has recently developed guidance targeted at addressing racial harassment. This includes recommendations to help universities and colleges improve their practice, and reflects students’ views on what is required.100
2021 action
In the coming year we will:
- Develop further regulatory and funding incentives for mature student participation.
- Continue collaborating with Uni Connect programmes to build on innovative delivery during the pandemic to support diverse pathways for students applying next year and beyond, including local progression from further education colleges.
- Work with Student Minds to mitigate the mental health effects of the pandemic.
- Relaunch the consultation on how universities and colleges should prevent and respond to incidents of harassment.
- Deepen our understanding of student populations, including the intersections between different groups, through the access and participation dataset and a new Associations Between Characteristics measure.
- Track student progress from outreach through to higher education and into employment, through the Higher Education Access Tracker and similar services.
- Develop evaluation practice and the use of evaluation findings through the OfS-funded ‘what works’ centre, Transforming Access and Student Outcomes in Higher Education.
For the OfS, regulation is a means to the end of better outcomes for all students. Higher education transforms individual lives and produces highly skilled graduates who make key contributions to the economy and wider society. To have maximum social and economic impact, however, our higher education system must be underpinned by the principle and practice of fair and equal opportunity for all. This is the challenge we have set for ourselves and for the sector.
64 OfS, ‘Support for disadvantaged students crucial as selective university numbers rise’, November 2020 (www.officeforstudents.org.uk/news-blog-and-events/press-and-media/support-for-disadvantaged-students-crucial-as-selective-university-numbers-rise/).
65 OfS, ‘Supporting disadvantaged students through higher education outreach’, July 2020 (www.officeforstudents.org.uk/publications/coronavirus-briefing-note-higher-education-outreach/#responding); Sutton Trust, ‘School shutdown’, April 2020 (available at https://www.suttontrust.com/our-research/covid-19-and-social-mobility-impact-brief/).
66 OfS, ‘Disabled students’, June 2020 (www.officeforstudents.org.uk/publications/coronavirus-briefing-note-disabled-students/#impact).
67 OfS, ‘Supporting student mental health’, April 2020 (www.officeforstudents.org.uk/publications/coronavirus-briefing-note-supporting-student-mental-health/).
68 OfS, ‘“Digital poverty”’ risks leaving students behind’, September 2020 (www.officeforstudents.org.uk/news-blog-and-events/press-and-media/digital-poverty-risks-leaving-students-behind/).
69 OfS, ‘Regulatory requirements during the coronavirus (COVID-19) pandemic’, March 2020 (available at www.officeforstudents.org.uk/publications/regulatory-requirements-during-the-coronavirus-covid-19-pandemic/), p2.
70 OfS, ‘Supporting black, Asian and minority ethnic students’, July 2020 (www.officeforstudents.org.uk/advice-and-guidance/coronavirus/case-studies/black-asian-and-minority-ethnic-students/).
71 OfS, ‘Students without family support’, May 2020 (www.officeforstudents.org.uk/publications/coronavirus-briefing-note-students-without-family-support/).
72 There is evidence that trans and non-binary students may be particularly impacted. OfS, ‘Supporting LGBT+ students’, July 2020 (www.officeforstudents.org.uk/advice-and-guidance/coronavirus/coronavirus-case-studies/lgbtplus-students/).
73 OfS, ‘Case studies and resources’ (www.officeforstudents.org.uk/advice-and-guidance/coronavirus/coronavirus-case-studies/); OfS, ‘Briefing notes’ (www.officeforstudents.org.uk/advice-and-guidance/coronavirus/briefing-notes/).
74 Disabled Students’ Commission, ‘Three months to make a difference’, July 2020 (available at https://www.advance-he.ac.uk/guidance/equality-diversity-and-inclusion/creating-inclusive-environment/disabled-people/disabled-students-commission).
75 OfS, ‘Transforming opportunity in higher education’, January 2020 (available at www.officeforstudents.org.uk/publications/transforming-opportunity-in-higher-education/).
76 OfS, ‘Securing student success: Regulatory framework for higher education in England’, February 2018 (available at www.officeforstudents.org.uk/publications/securing-student-success-regulatory-framework-for-higher-education-in-england/), p15.
77 The POLAR classification groups areas across the UK based on the proportion of young people who participate in higher education. It looks at how likely young people are to participate in higher education across the UK, and shows how this varies by area. POLAR classifies local areas into five groups, or ‘quintiles’, based on the proportion of young people who enter higher education aged 18 or 19. Quintile 1 shows the lowest rate of participation; quintile 5 shows the highest. For more information see www.officeforstudents.org.uk/data-and-analysis/young-participation-by-area/about-polar-and-adult-he/.
78 OfS, ‘Official statistic: Key performance measure 2’ (https://webarchive.nationalarchives.gov.uk/ukgwa/20201201190010/https://www.officeforstudents.org.uk/about/measures-of-our-success/participation-performance-measures/gap-in-participation-at-higher-tariff-providers-between-the-most-and-least-represented-groups/).
79 For the purposes of this analysis we have assumed that the number of quintile 5 entrants will remain constant, and so closing the gap will have been achieved by increasing the proportion of quintile 1 entrants from 6.9 per cent to 10.9 per cent. OfS, ‘Transforming opportunity in higher education’, January 2020 (available at www.officeforstudents.org.uk/publications/transforming-opportunity-in-higher-education/), p23.
80 This figure assumes that any closing of the gap in entry rates at high-tariff universities and colleges between the most and least represented groups is achieved by growth in the number of entrants from those areas least represented in higher education with no growth in the rest of the sector. OfS, ‘Transforming opportunity in higher education’, January 2020 (available at www.officeforstudents.org.uk/publications/transforming-opportunity-in-higher-education/), p23.
81 OfS, ‘Official statistic: Key performance measure 4’, (https://webarchive.nationalarchives.gov.uk/ukgwa/20201201190009mp_/https://www.officeforstudents.org.uk/about/measures-of-our-success/participation-performance-measures/gap-in-degree-outcomes-1sts-or-21s-between-white-students-and-black-students/).
82 OfS, ‘Transforming opportunity in higher education’, January 2020 (available at www.officeforstudents.org.uk/publications/transforming-opportunity-in-higher-education/), p4.
83 OfS, ’Differences in student outcomes: Further characteristics’, June 2020 (available at www.officeforstudents.org.uk/publications/differences-in-student-outcomes-further-characteristics/).
84 OfS, ’Differences in student outcomes: Further characteristics’, June 2020 (available at www.officeforstudents.org.uk/publications/differences-in-student-outcomes-further-characteristics/), pp10-11.
85 OfS, ’Differences in student outcomes: Further characteristics’, June 2020 (available at www.officeforstudents.org.uk/publications/differences-in-student-outcomes-further-characteristics/), p2.
86 Holmes, Emma, et al, ‘Multidisciplinary research priorities for the COVID-19 pandemic: A call for action for mental health science’, The Lancet, June 2020 (https://www.thelancet.com/journals/lanpsy/article/PIIS2215-0366(20)30168-1/fulltext).
87 OfS, ‘Guidance for providers about quality and standards during the coronavirus (COVID-19) pandemic’, April 2020 (available at www.officeforstudents.org.uk/publications/guidance-for-providers-about-quality-and-standards-during-coronavirus-pandemic/), p8.
88 Student Minds, ‘Student Space is live! What is it, and what comes next?’, August 2020 (https://www.studentminds.org.uk/latestnews/student-space-is-live-what-is-it-and-what-comes-next).
89 OfS, ‘Equality and diversity student data’ (available at www.officeforstudents.org.uk/data-and-analysis/student-characteristics-data/).
90 OfS, ‘Equality and diversity data’ (available at www.officeforstudents.org.uk/data-and-analysis/student-characteristics-data/).
91 OfS, ‘Mature students’, July 2020 (www.officeforstudents.org.uk/advice-and-guidance/promoting-equal-opportunities/effective-practice/mature-students/).
92 Office for National Statistics, ‘Sexual offences in England and Wales: Year ending March 2017’, February 2018 (https://www.ons.gov.uk/peoplepopulationandcommunity/crimeandjustice/articles/
sexualoffencesinenglandandwales/yearendingmarch2017).
93 Brook, ‘Our new research on sexual harassment and violence at UK universities’, February 2019 (https://legacy.brook.org.uk/press-releases/sexual-violence-and-harassment-remains-rife-in-universities-according-to-ne).
94 National Union of Students, ‘The experience of Jewish students in 2016-17’, (available at https://www.nusconnect.org.uk/resources/the-experience-of-jewish-students-in-2016-17), p27.
95 National Union of Students, ‘The experience of Muslim students in 2017-18, March 2018’ (available at https://www.nusconnect.org.uk/resources/the-experience-of-muslim-students-in-2017-18), p18.
96 Equality and Human Rights Commission, ‘Tackling racial harassment: Universities challenged’, October 2019 (available at https://www.equalityhumanrights.com/en/publication-download/tackling-racial-harassment-universities-challenged), pp6, 9.
97 OfS, ‘Supporting international students’, May 2020 (www.officeforstudents.org.uk/publications/coronavirus-briefing-note-supporting-international-students/#harassment).
98 Anna Fazackerley, ‘It's not banter, it's racism: UK students accuse universities of brushing complaints aside’, The Guardian, 7 July 2020 (https://www.theguardian.com/education/2020/jul/07/its-not-banter-its-racism-uk-students-accuse-universities-of-brushing-complaints-aside).
99 Minister of State for Universities, ‘Letter to international students from the Minister of State for Universities’, April 2020 (available at https://www.ukcisa.org.uk/studentnews/1502/Letter-to-international-students-from-the-Minister-of-State-for-Universities).
100 Universities UK, 'Tackling racial harassment in higher education', November 2020 (available at https://www.universitiesuk.ac.uk/tackling-racial-harassment).
Describe your experience of using this website